Bitcoin on the Brink: Will the $74K Support Make or Break the Crypto Giant’s Future?

So, Bitcoin just took a little tumble off its $80,000 perch over the weekend—classic crypto drama, right? Now, all eyes are glued to the $74,000-$75,000 range, a stubbornly resilient support zone that’s been holding the fort for the past couple of years. Crypto analyst Ardi even calls this upcoming retest “the most important support test” of the current bear market — no pressure, BTC! It’s wild when you think about it: back in 2024, Bitcoin was stuck consolidating below this range for seven months, then it bounced off it in early 2025 to rocket towards $126,000. Now, after a slight 5.78% weekly dip to around $77,900, Bitcoin’s creeping back to this crucial zone — with more history hanging on this pivot than an old-timey clock. Meanwhile, traders like Alex Wacy are squinting at the $70,000 mark — hold that line, and we might be eyeing a rebound towards $85,000-$90,000; lose it, and a dive to $50,000-$60,000 beckons. With market signals flipping bearish again and seasoned investors moving their coins onto exchanges, it feels like we’re at a crossroads. Will Bitcoin hold or fold under the weight of its own legacy and those looming sell pressures? One thing’s for sure: this isn’t just another number on the chart — it’s a potential turning point that’s got everyone biting their nails. LEARN MORE
Bitcoin (BTC) lost its hold on the $80,000 level over the weekend, and data suggest that the cryptocurrency needs to trade above the $74,000-$75,000 range, as it has repeatedly served as key support over the last two years.
Crypto analyst Ardi said the next retest of the $74,000-$75,000 range could become the most important support test of the current bear market.
The analyst pointed to the role that the price range played during the last two years. In 2024, Bitcoin struggled to break above the range during a seven-month-long consolidation. In Q1 2025, the same area held as support before BTC rallied toward its cycle highs at $126,000.
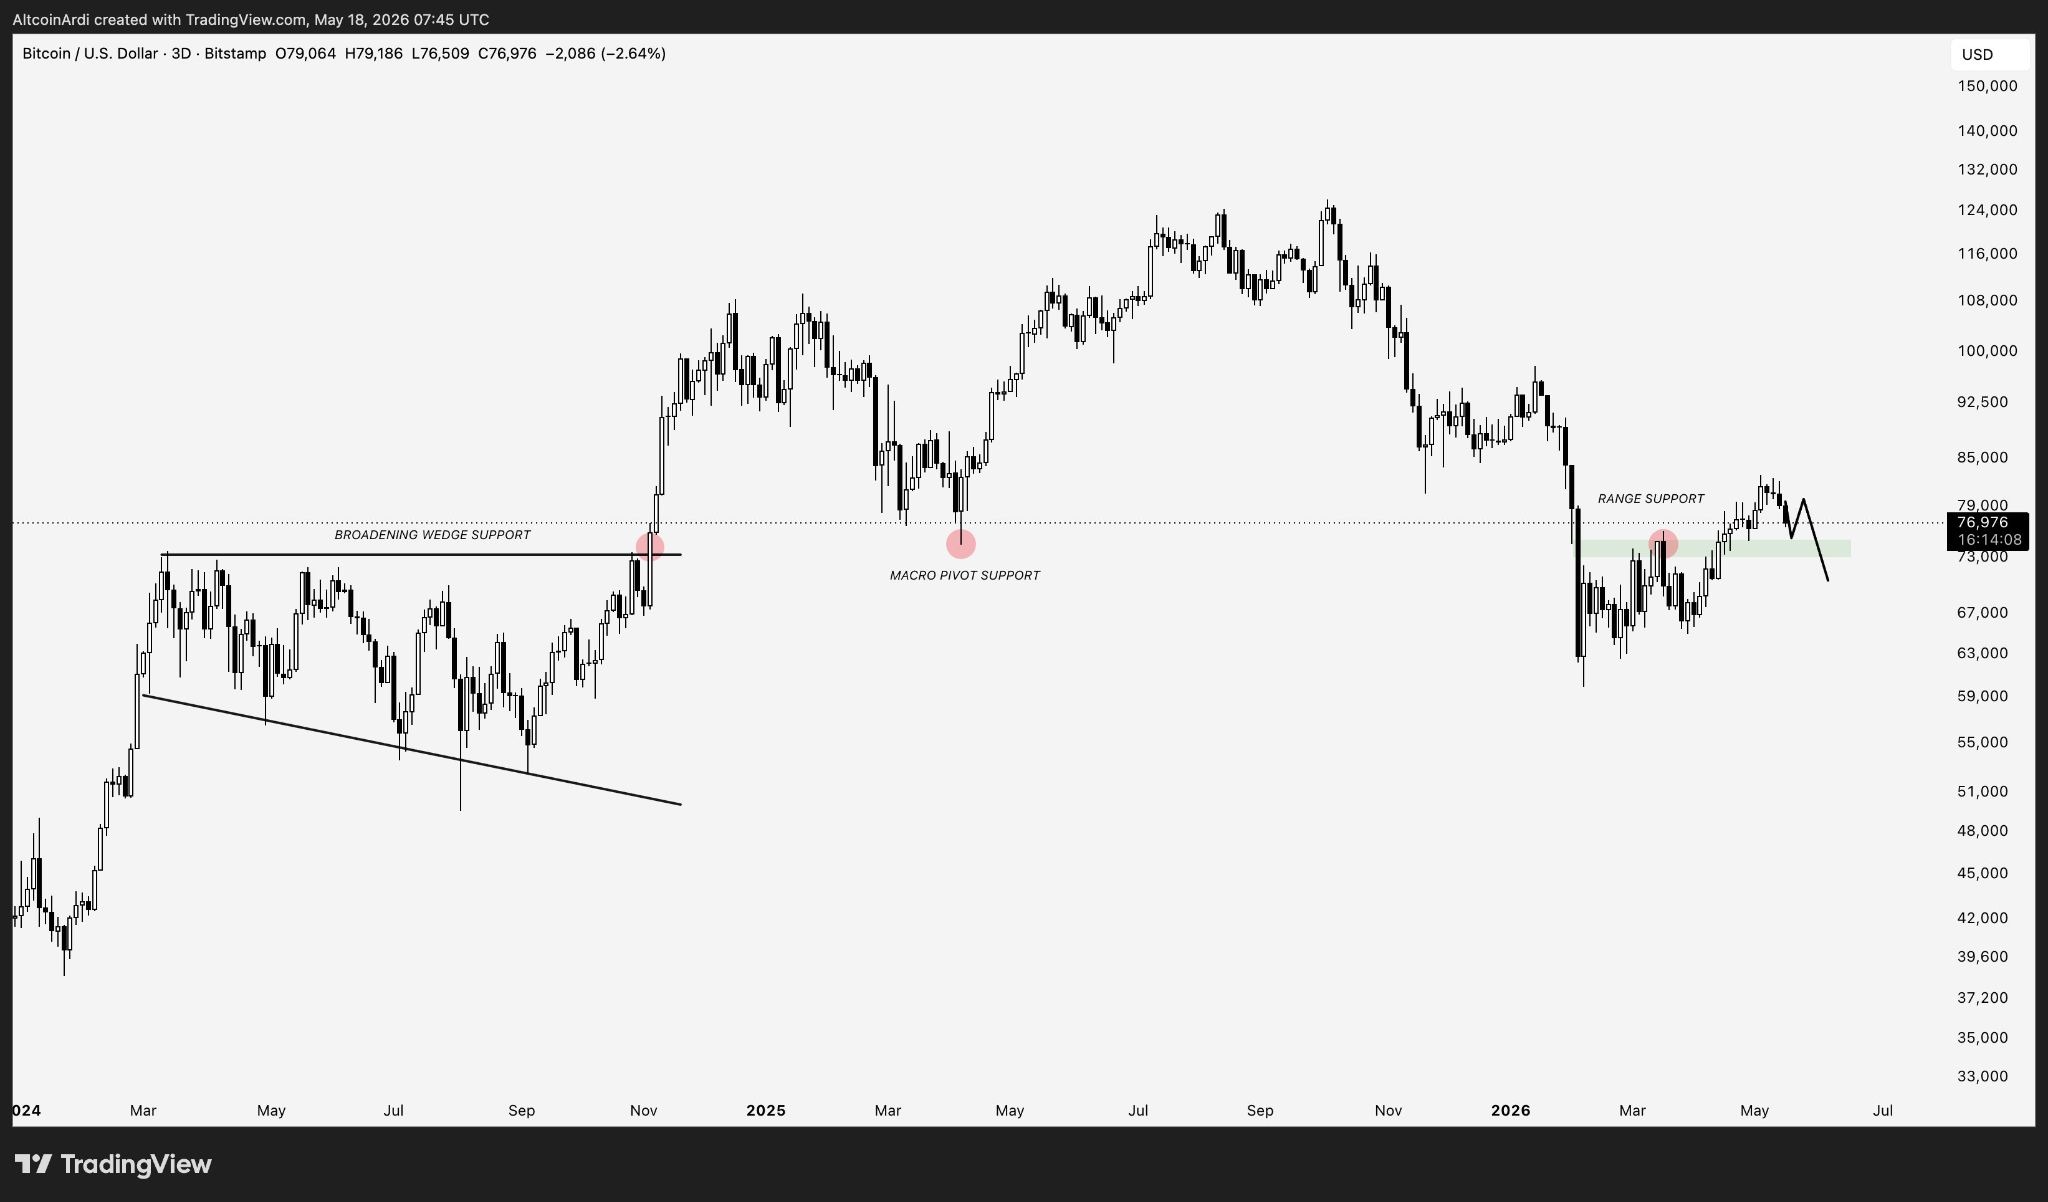
BTC/USD, one-day chart analysis by Ardi. Source: X
Bitcoin is now approaching this level after its 5.78% weekly correction to $77,900. Ardi said the zone carries added weight because several major price pivots formed at $74,000-$75,000 across multiple time frames.
Crypto trader Alex Wacy focused on the $70,000 level. Wacy said holding that area could support a move back toward $85,000-$90,000. Losing it could open the door to a larger decline toward the $50,000-$60,000 range.
Related: BTC price ‘bull trap’ at $76.5K? Five things to know in Bitcoin this week
Bitcoin market signal weakens again
Bitcoin researcher Axel Adler Jr. said the Bitcoin bull-bear structure index turned bearish again after BTC failed to stay above $82,000 earlier this month.
It tracks six indicators linked to exchange-traded fund (ETF) demand, trader activity, exchange flows, and short-term price momentum. A positive reading indicates buyers are in control, while a negative reading points to growing seller pressure.
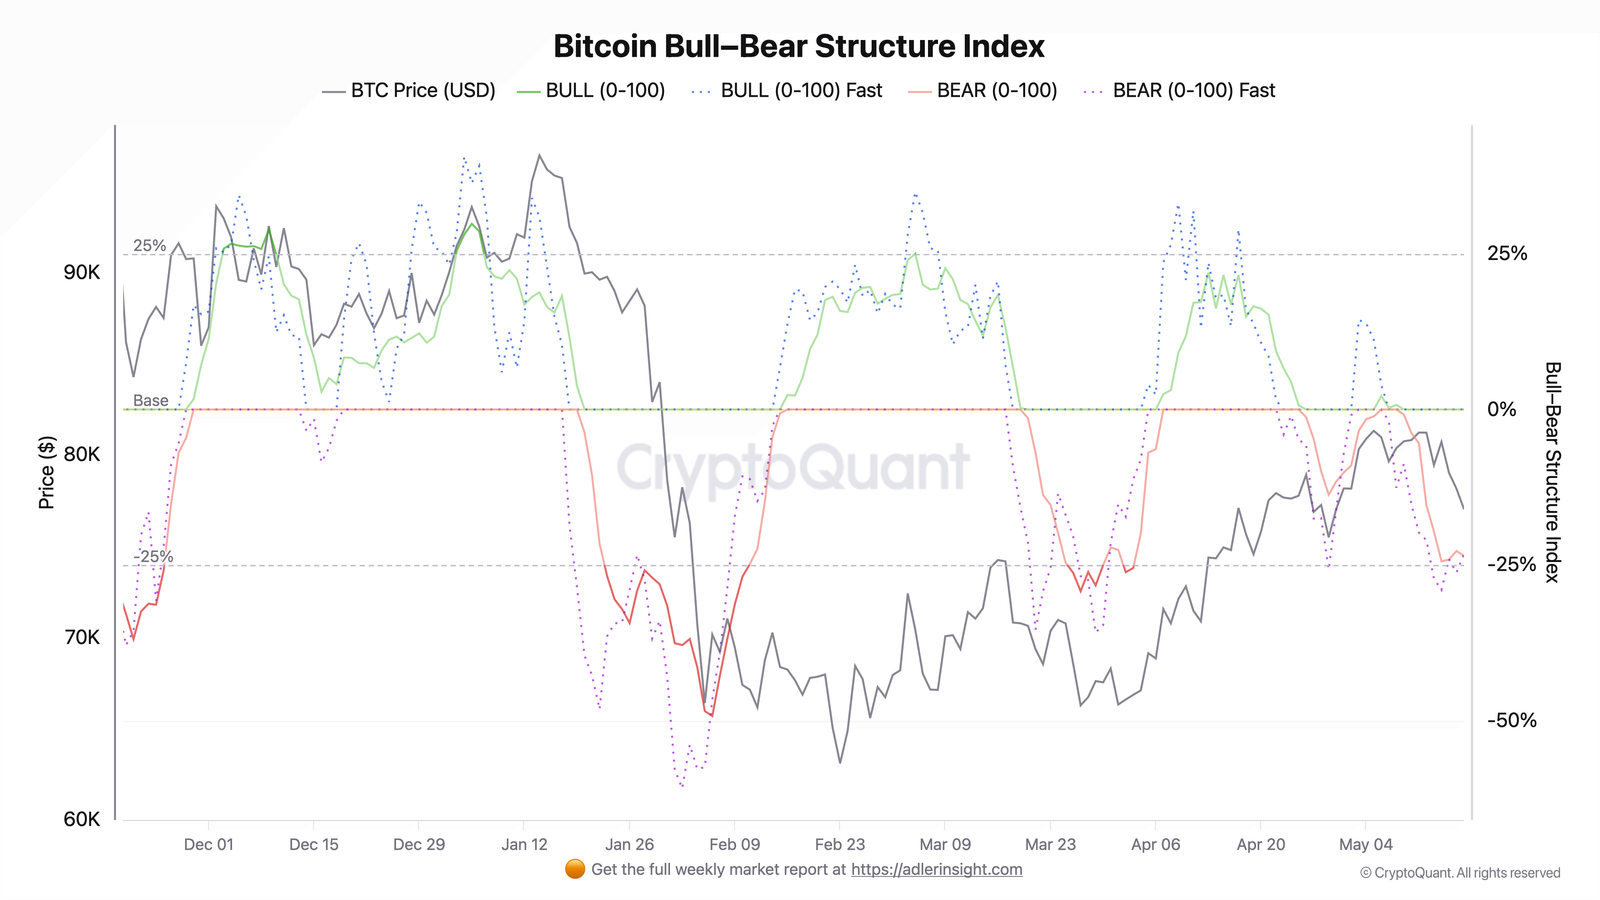
Bitcoin bull-bear structure index. Source: CryptoQuant
The bullish signal lasted less than three trading days. On May 6, the index briefly turned positive as Bitcoin climbed near $82,000. By May 17, the reading had dropped to -23.49, indicating that sellers quickly regained control.
Meanwhile, CryptoQuant data showed more Bitcoin moving onto exchanges from investors who bought BTC six to 12 months ago. The average buying price was around $110,851, meaning many are now sitting on large unrealized losses after the latest drop.
The share of older coins moving to exchanges also surged to 10.54%, far above its usual level below 1%, with market analyst Easy On Chain stating,
“Historically, this reflects investors locking in major losses and exiting the market, creating severe spot-market selling pressure.”
Related: Saylor’s Strategy scoops $2B Bitcoin, holdings reach 843,738 BTC