WTI Crude Oil on the Edge: Is a Major Reversal About to Shake the Market?
Ever caught yourself squinting at a chart, wondering if you’re witnessing an “inverted head and shoulders” pattern—and if that’s code for a bullish rally about to take off? Well, that’s exactly the intriguing question WTI crude oil traders are grappling with right now on the 4-hour chart. After tumbling below the $62 mark in early October, oil’s been clawing its way back, possibly lining up for a classic reversal that could fuel a longer-term uptrend—if it manages to break through the looming neckline resistance. It’s like watching a suspense thriller unfold, only the stakes are barrels of oil and potential profits. Will the bullish momentum build enough to send prices soaring—or is this just a brief respite before another slide? For anyone trading or investing in energy commodities, keeping a hawk’s eye on this developing setup—and the broader economic currents—is essential. Curious to dive deeper? LEARN MORE.
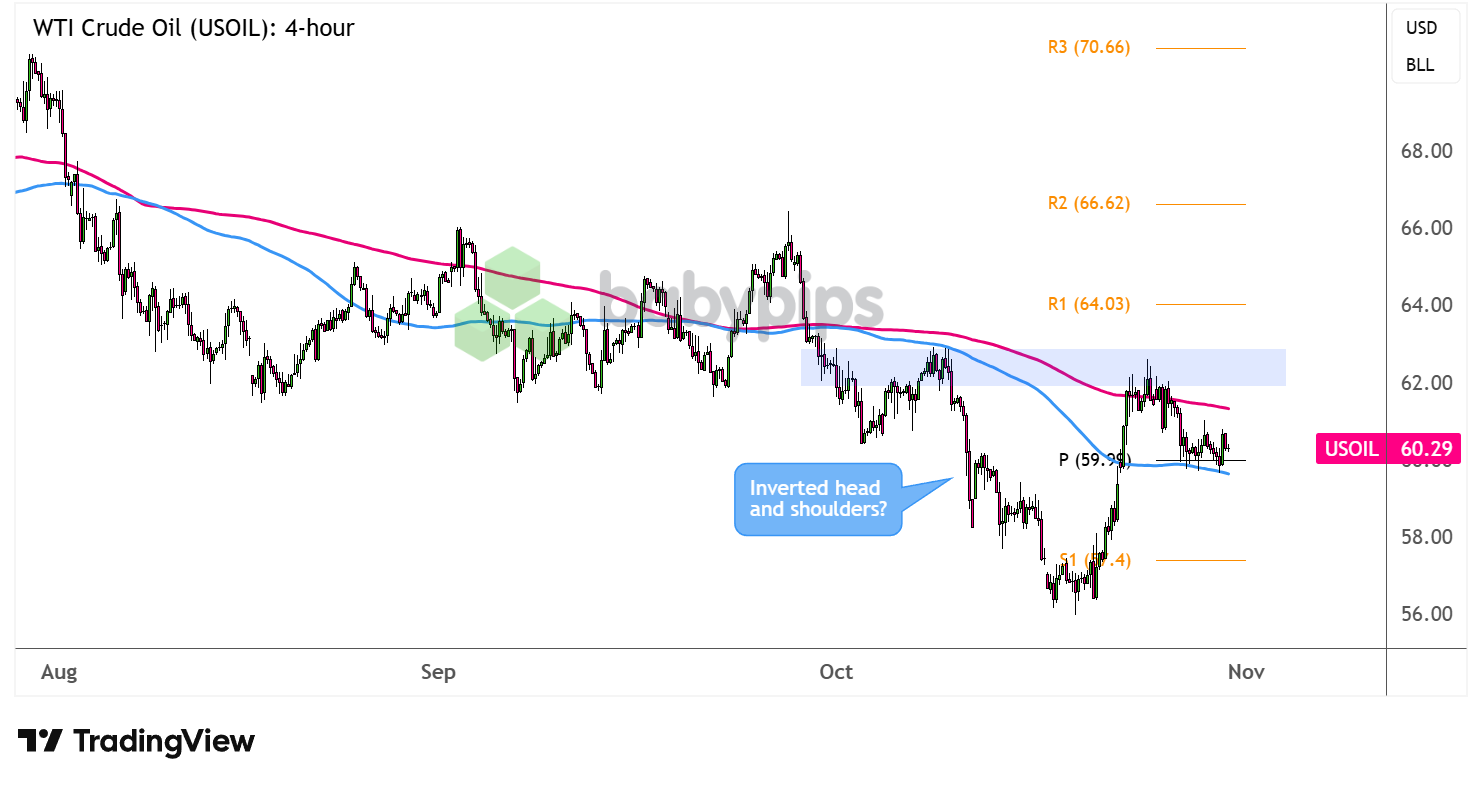
Is that a potential inverted head and shoulders pattern forming on the 4-hour chart of WTI crude oil?
The energy commodity could be gearing up for a longer-term uptrend as soon as its clears the nearby upside barrier.
Take a look at this neckline forming at an area of interest!

WTI Crude Oil (USOIL) 4-hour Chart by TradingView
After breaking below support around the $62 per barrel mark in early October, WTI crude oil has pulled up from its slide and appears to be forming a classic reversal chart pattern.
The pair has yet to test the neckline resistance around the former support zone, before potentially going for a climb that’s the same height as the formation.
Can it get enough bullish momentum to do so?
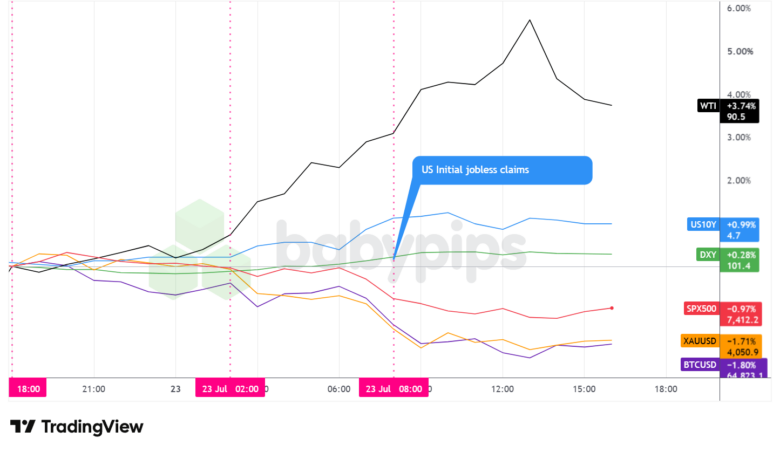
Remember that directional biases and volatility conditions in market price are typically driven by fundamentals. If you haven’t yet done your homework on the WTI crude oil and the U.S. dollar, then it’s time to check out the economic calendar and stay updated on daily fundamental news!
Price is currently finding some support at the pivot point ($59.99) which is right around the 100 SMA dynamic inflection point and near a major psychological level. Look out for a bounce from this area that could take crude oil back up to the area of interest and possibly extend its rally.
If this happens, oil bulls could set their sights on the bullish targets at R1 ($64.03) then R2 ($66.62) near the September highs. On the other hand, a break below current levels could allow the commodity to revisit the current month lows close to S1 ($57.40).
Don’t forget that the latest FOMC statement wound up overall bullish for the dollar after Fed head Powell dampened expectations for December easing.
Whichever bias you end up trading, don’t forget to practice proper risk management and stay aware of top-tier catalysts that could influence overall market sentiment.
Disclaimer:
Please be aware that the technical analysis content provided herein is for informational and educational purposes only. It should not be construed as trading advice or a suggestion of any specific directional bias. Technical analysis is just one aspect of a comprehensive trading strategy. The technical setups discussed are intended to highlight potential areas of interest that other traders may be observing. Ultimately, all trading decisions, risk management strategies, and their resulting outcomes are the sole responsibility of each individual trader. Please trade responsibly.