Willy Woo’s 10,000 Bitcoin Simulations Predict a Shocking $413,000 Peak in 2028—Is This the Crypto Breakthrough We’ve Been Waiting For?
Ever wondered what it would look like if we could peer into Bitcoin’s future—not with a crystal ball but with 10,000 different possible paths mapped out by a savvy on-chain analyst? Well, Willy Woo just dropped such a mind-boggling simulation, built on a random-walk model that respects Bitcoin’s historical rhythm and its ever-shrinking gains with each cycle. The headline grabber? A median projection peaking at $413,000 by December 2028. Sounds like a moonshot, right? But before you start daydreaming of Lambos, remember Willy’s cautious footnote: “It’s a simulation, NOT my prediction.” So, what’s really cooking behind those thousands of simulated price trajectories? And how much wiggle room are we really giving ourselves when banking on this data? Let’s unpack the model’s intrigue, the fine print it leaves out, and what it means for Bitcoin trading at a cool $79,770 today. LEARN MORE.
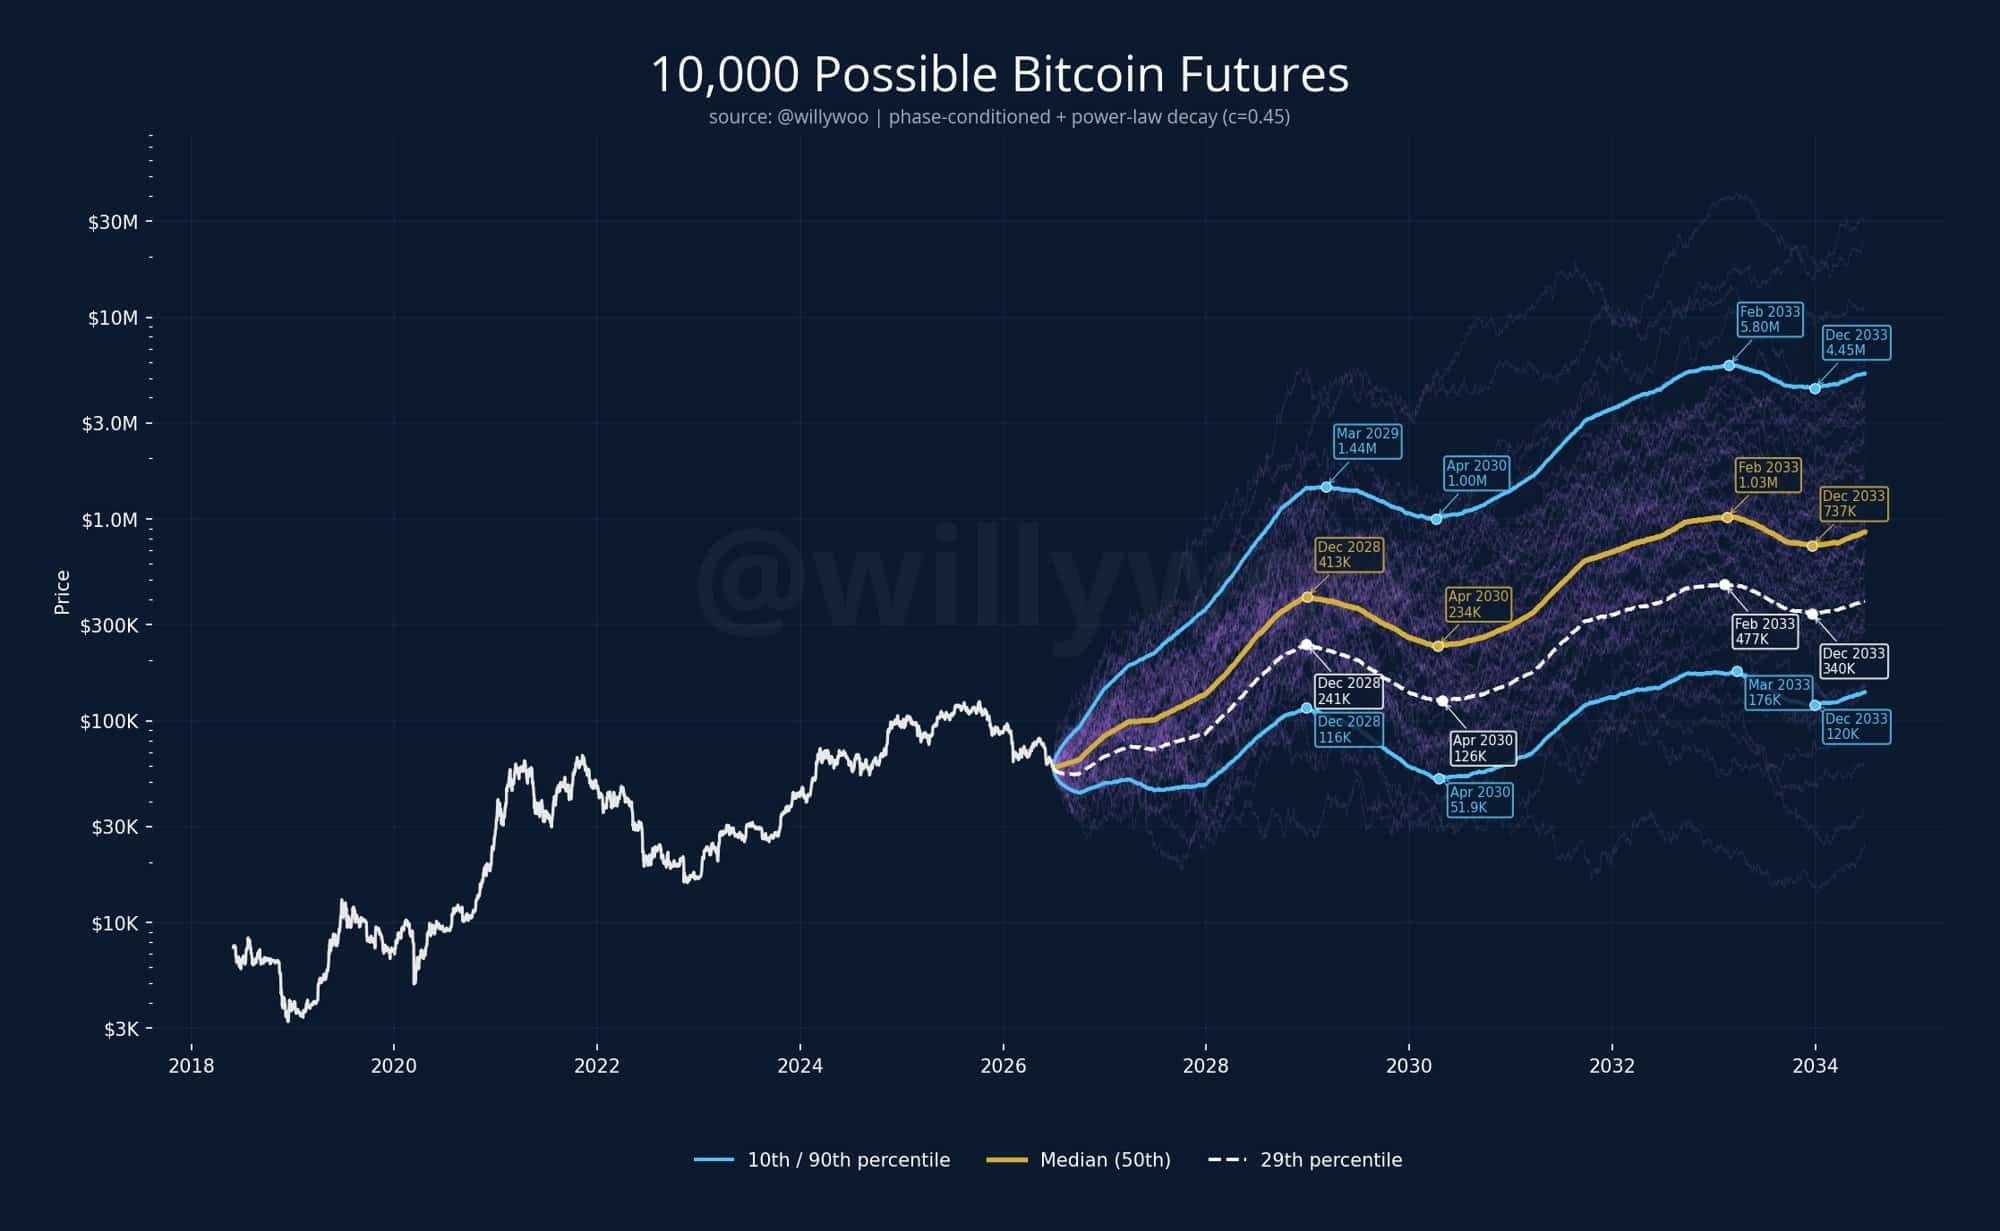
On-chain analyst Willy Woo posted 10,000 simulated price paths for Bitcoin on Monday, October 26, from a random-walk model trained on BTC’s history that builds in the shrinking returns of each cycle, to map where the next tops and bottoms could land. The Bitcoin news traders noticed: the median path peaks at $413,000 in December 2028.
Woo himself is more cautious. “She’s optimistic,” he wrote, naming the band between roughly the 28th and 50th percentile as reasonable, a 2028 top between $241,000 and $413,000, and adding: “It’s a simulation, NOT my prediction.”
Bitcoin trades at $79,770 today. So what did the model find, and what does it leave out?
10,000 POSSIBLE FUTURE PATHS
A random-walk simulation trained on BTC accounting for power law degradation of returns.
She’s optimistic, I think between 28th and 50th percentile is reasonable.
i.e. 2028 top between 241k-413k
It’s a simulation, NOT my prediction. pic.twitter.com/RpjaRKkSQJ
— Willy Woo (@willywoo) October 26, 2026
Market Intelligence: Crypto Analyst Predicts Best Low-Cap Crypto
Bitcoin News: What Did Willy Woo’s 10,000 Simulated Paths Show?
A rising staircase with deep steps. Every percentile line keeps Bitcoin’s four-year rhythm: a top in late 2028 or early 2029, a bear-market low around April 2030, and another peak in February 2033.
| Path | 2028–29 top | April 2030 low | February 2033 top |
|---|---|---|---|
| 90th percentile | $1.44 million (March 2029) | $1.00 million | $5.80 million |
| Median | $413,000 (December 2028) | $234,000 | $1.03 million |
| 29th percentile | $241,000 (December 2028) | $126,000 | $477,000 |
| 10th percentile | $116,000 (December 2028) | $51,900 | $176,000 |
The spread is the real result. By February 2033, the 90th percentile sits 33 times above the 10th. Even the gloomy 10th percentile ends 2033 at $120,000, but its 2030 low of $51,900 is about 35% below today’s price.

10,000 simulated Bitcoin price paths. Source: Willy Woo on X
What is the “power-law degradation of returns”? It is the idea that each Bitcoin cycle grows by less than the one before. The bigger the asset gets, the more money it takes to move it.
The history fits. Bitcoin went from about $1,150 at its 2013 top to nearly $20,000 in late 2017, a 17-fold gain. The 2021 top of $69,000 was about 3.5 times that, and October 2025’s record of $126,080 was only 1.8 times.
A power law describes that slide: returns fade steadily over time instead of in random jumps. The “c=0.45” in the chart’s subtitle sets how fast they fade. “Phase-conditioned” means each simulated day is drawn to match where Bitcoin sits in its cycle, whether rally, top, bear market, or recovery, which is why all 10,000 paths keep the four-year shape.
Next to that history, the median still looks generous. A $413,000 top would be 3.3 times the 2025 peak, almost double the last cycle’s gain. Woo’s lower bound, $241,000, is 1.9 times the peak, in line with the 1.8 times of the last cycle.
DISCOVER: Is Something Huge Brewing for Bitcoin? Perplexity AI Predicts a Big Move on the Horizon
What Does the Simulation Leave Out?
A lot, which is why Woo calls it a simulation. A random walk trained on past prices assumes Bitcoin will keep moving the way it has, with similar swings and the same four-year rhythm. The market around it has changed.
- New buyers: U.S. spot ETFs hold about $102.8 billion of Bitcoin, and Strategy alone holds 848,517 BTC. Neither existed in earlier cycles, and their flows don’t follow the halving.
- Rates and liquidity: the Federal Reserve raised rates in September and decides again on Wednesday. Every past cycle top came with easy money.
- Supply: 20.1 million of the 21 million coins are already mined, so each halving cuts new supply by less in dollar terms.
- Rules and risks: regulation, competition, and technical threats such as quantum computing are outside any price model.
- A small sample: Bitcoin has had only four full cycles, so 10,000 paths still rest on four tops.
So the chart is a map of possibilities, with no price target and no timing in it.
Bitcoin Price Today: What Are the Levels to Watch?
Bitcoin trades at $79,770, down 2.1% in a week and 36.7% below its October 2025 record. It sits under the 50-day EMA at $80,765, and buyers defended $79,221 on Saturday and again on Monday.
Resistance comes at $81,480, where last week’s bounces stalled, and then at $82,850. Support sits at $79,221, Saturday’s low, with the 200-day EMA at $76,382 below it.

BTCUSDT 1D chart. Source: TradingView
| Scenario | What it takes | Where BTC could go |
|---|---|---|
| Breakout | A daily close above $81,480 | $82,850, last week’s ceiling |
| Range | Holding between $79,221 and $81,480 | Back and forth around the 50-day EMA at $80,765 |
| Breakdown | A daily close below $79,221 | $76,382, the 200-day EMA |
To reach even the low end of Woo’s band by 2028, Bitcoin would need to triple from here. The Bitcoin news that matters this week is smaller: whether $79,221 holds through Wednesday’s Fed decision.
EXPLORE: Bitcoin Holds $79,200 Before the Fed, Coinbase Earnings and a $10.9B Expiry: Which Way Next?
Disclaimer: Coinspeaker is committed to providing unbiased and transparent reporting. This article aims to deliver accurate and timely information but should not be taken as financial or investment advice. Since market conditions can change rapidly, we encourage you to verify information on your own and consult with a professional before making any decisions based on this content.

Daniel Frances is a technical writer and Web3 educator specializing in macroeconomics and DeFi mechanics. A crypto native since 2017, Daniel leverages his background in on-chain analytics to author evidence-based reports and deep-dive guides. He holds certifications from The Blockchain Council, and is dedicated to providing “information gain” that cuts through market hype to find real-world blockchain utility.













Post Comment