Why Facebook Ad Costs Are Dropping – And What It Means for Your Campaigns
Is Facebook still the land of opportunity for advertisers in 2026, or are cheaper clicks just a mirage? Well, buckle up – it turns out that Facebook ad campaigns are actually delivering more bang for your buck this year. We’re talking clicks that cost less, engagement rates that are climbing, and lead costs that stubbornly hold their ground without soaring. After digging through nearly 1,800 campaigns across all sorts of industries, WordStream by LocaliQ dropped some juicy stats: average click-through rates are up almost 13%, while cost per click has taken a tidy 14% nosedive. Intriguing, right? But here’s the kicker – it’s not just about cheaper clicks; it’s about smarter spending, with Meta’s latest tweaks making ad buys more efficient than ever. If you’ve been juggling your paid search and social budgets wondering if you can have it all, well, Facebook might just be tipping the scales in your favor this year. Curious how your industry stacks up or where the biggest improvements lie? Let’s dive in and unpack what this means for you. LEARN MORE.
Facebook advertisers are getting cheaper clicks and stronger engagement in 2026, while lead costs remain largely flat, according to new WordStream by LocaliQ benchmark data.
The report analyzed nearly 1,800 Facebook ad campaigns across industries, looking at click-through rate (CTR), cost per click (CPC), conversion rate (CVR) and cost per lead (CPL) for traffic and leads campaigns.
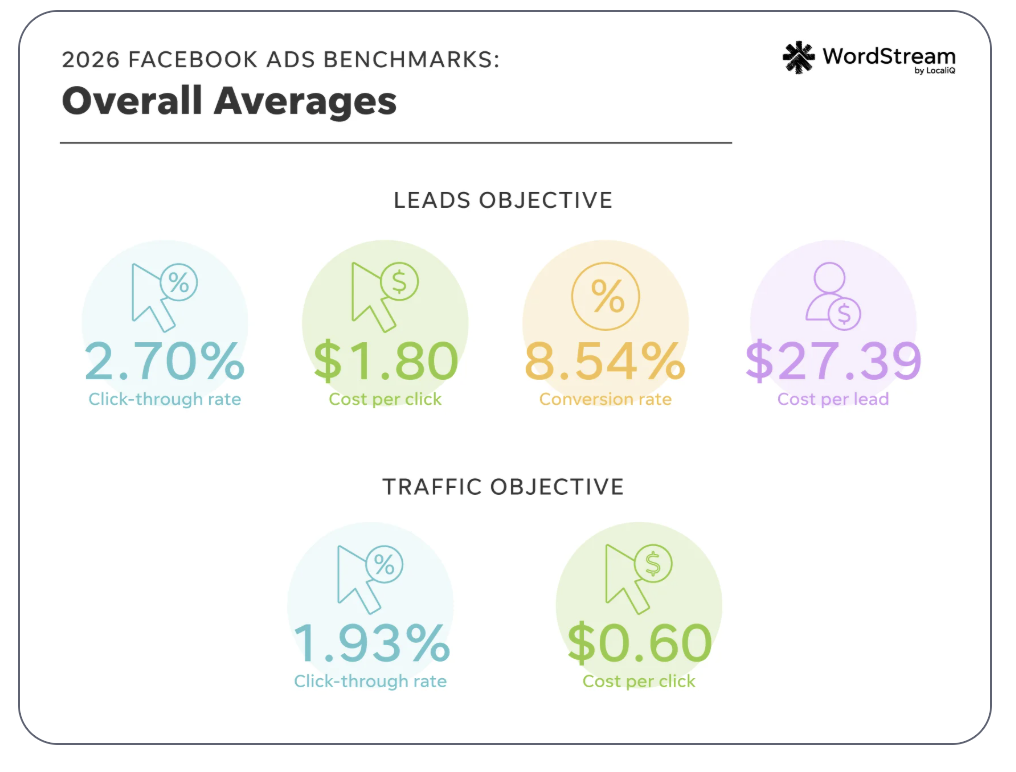
Overall 2026 traffic benchmarks:
- Average click-through rate: 1.93% (up 12.87% YoY).
- Average cost per click: $0.60 (down 14.29% YoY).

Traffic campaigns improve. Facebook traffic campaigns delivered a particularly strong year, with engagement rising while clicks became cheaper.

Only two industries saw traffic CPCs increase year over year: Shopping, Collectibles and Gifts (+73.53%) and Sports and Recreation (+43.90%).
Real Estate recorded the biggest CPC improvement, falling 39.56%, followed by Restaurants and Food (-37.50%) and Industrial and Commercial (-37.21%).
Lead campaigns. The picture was also broadly positive for advertisers focused on generating leads:
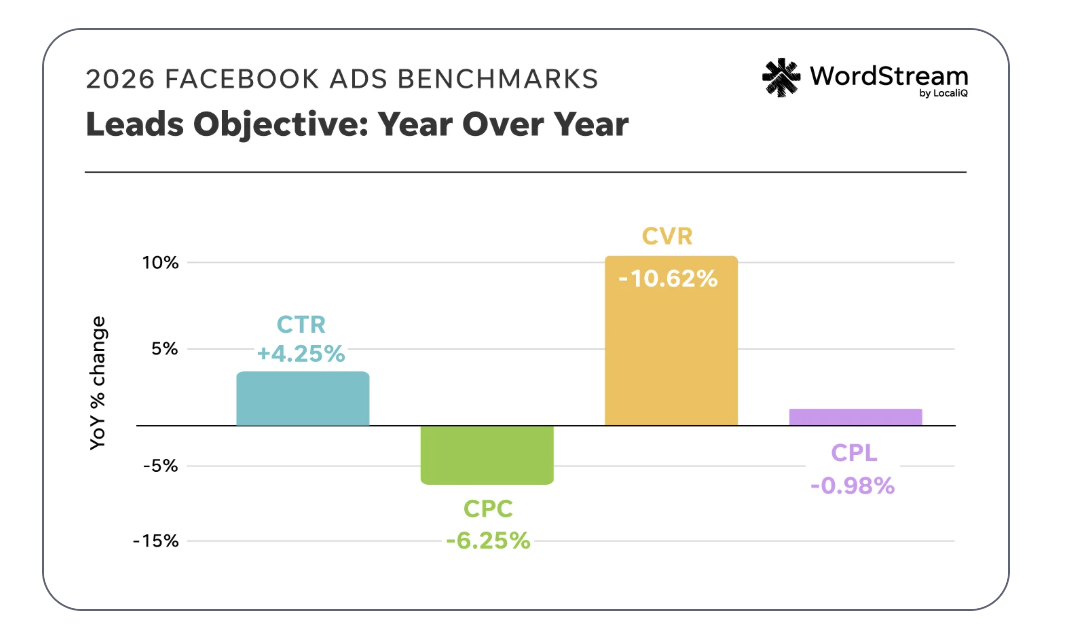
- Average CTR: 2.70% (up 4.25% YoY).
- Average CPC: $1.80 (down 6.25% YoY).
- Average CVR: 8.54%.
- Average CPL: $27.39 (down 0.98% YoY).
Cost-per-click winners. Most industries saw cheaper clicks on lead campaigns. Automotive – For Sale CPC fell 44.17%, Dentists and Dental Services dropped 41.72%, and Health and Fitness declined 30.30%.
Only Education and Instruction (+4.24%) and Sports and Recreation (+0.93%) recorded higher lead campaign CPCs.
Cost-per-lead reality check. CPL varied considerably by industry.
Lowest CPL:
- Career and Employment: $12.30.
- Real Estate: $13.74.
- Arts and Entertainment: $14.59.
Highest CPL:
- Dentists and Dental Services: $61.56.
- Beauty and Personal Care: $50.91.
- Home and Home Improvement: $42.95.
Why we care. Facebook advertisers are effectively getting more engagement for less money. Traffic clicks became 14% cheaper while CTR improved nearly 13%, and lead campaigns generated cheaper clicks while keeping average CPL virtually unchanged.
For advertisers balancing paid search and paid social budgets, that matters. WordStream notes that Google Ads CPC is now more than double Meta’s average CPC, although Google Search typically captures users with stronger purchase intent.
The big picture. Meta’s optimization appears to be getting more efficient. WordStream said improvements to bidding and campaign optimization may be contributing to stronger conversion performance and lower costs.
The 2026 numbers suggest advertisers don’t necessarily have to choose between cheaper traffic and better performance: for many Facebook campaigns, they’re getting both.
Bottom line. Facebook advertising got more efficient in 2026. Clicks are cheaper, engagement is improving and lead costs are holding steady — giving advertisers more room to stretch their paid social budgets.
Dig deeper. Facebook Ads Benchmarks 2026: NEW Data, Trends, & Insights for Your Industry
Topics on this page
Search Engine Land is owned by Semrush. We remain committed to providing high-quality coverage of marketing topics. Unless otherwise noted, this page’s content was written by either an employee or a paid contractor of Semrush Inc.
About the Author







Post Comment