Unlock Hidden Insights: How Google Search Console’s New Custom Annotations Could Transform Your SEO Strategy
Ever wished you could scribble a quick note right on your Google Search Console charts to remind yourself why traffic dipped or skyrocketed on a certain day? Well, Google just made that wish come true with its new custom annotations feature. Now, instead of juggling spreadsheets or digging through old emails to connect site tweaks or campaign launches with traffic shifts, you can pin down those moments right where the data lives. Think of it as a digital Post-it for your SEO brain — neat, handy, and visible to your whole team (just keep those juicy secrets to yourself, okay?). This might just change how we track, analyze, and collaborate on SEO movements—finally turning chaos into clarity. Curious how to get those gems onto your charts? Dive in and see for yourself! LEARN MORE

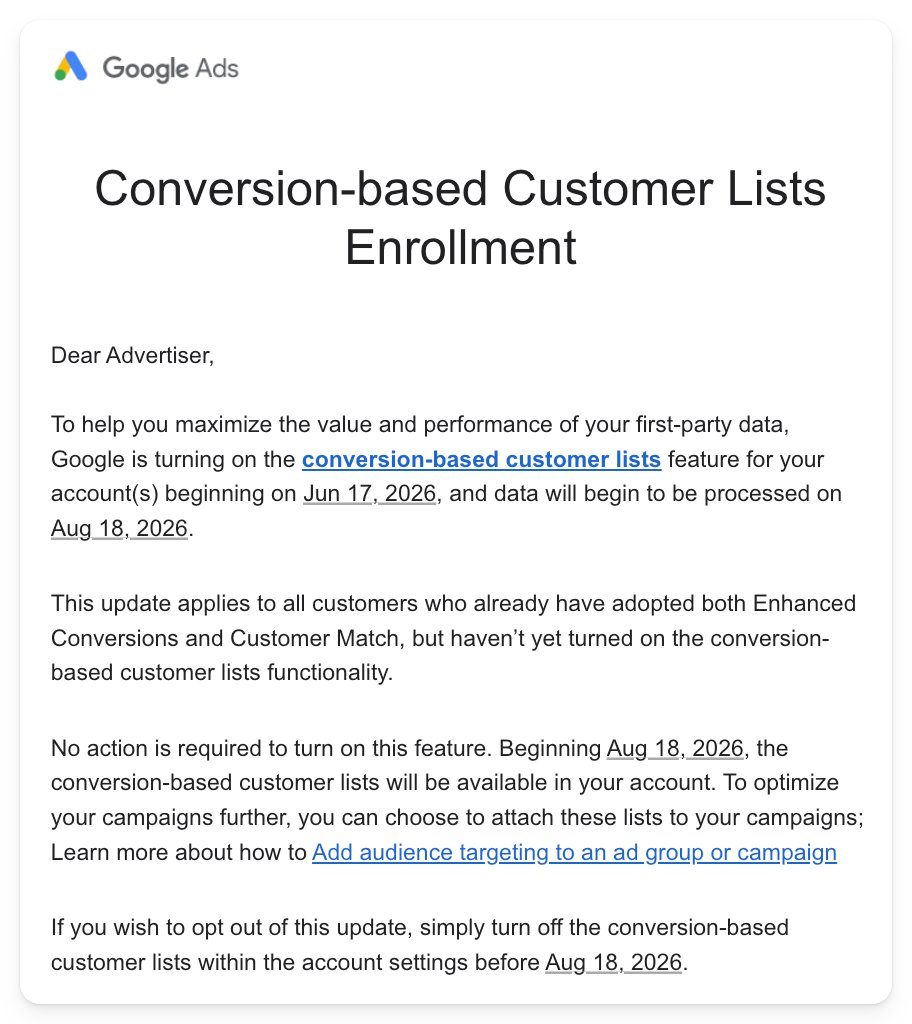
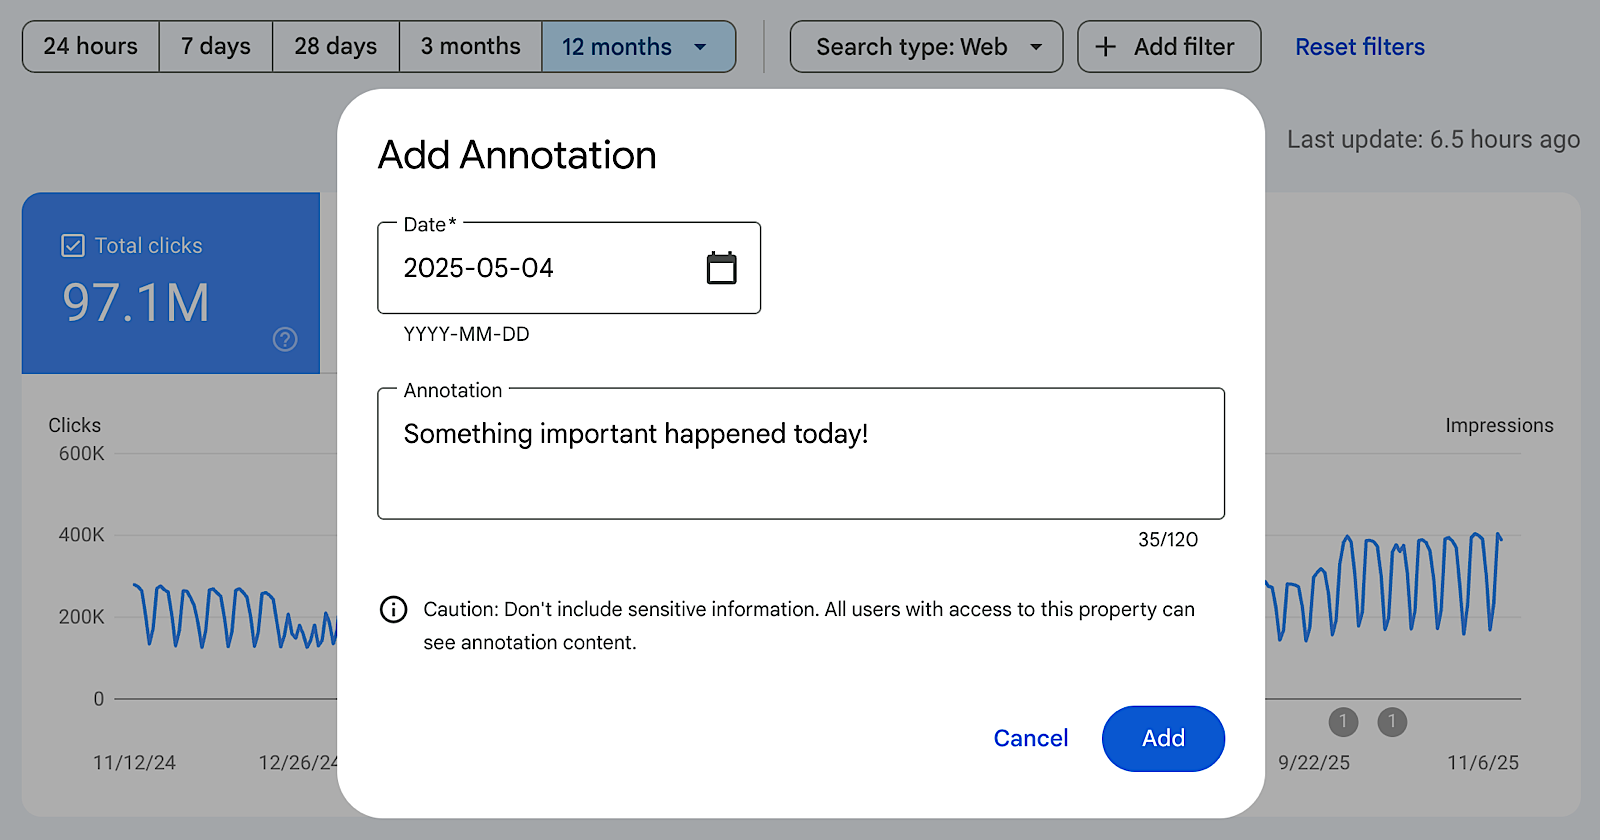
Google launched custom annotations in Search Console performance reports, giving you a way to add contextual notes directly to traffic data charts.
The feature lets you mark specific dates with notes explaining site changes or external events that affected search performance.
What The Feature Does
Custom annotations appear as markers on Search Console charts. Google’s announcement highlights several common use cases, including infrastructure changes, SEO work, content strategy shifts, and external events that affect business performance such as holidays.
All annotations are visible to everyone with access to a Search Console property. Google recommends avoiding sensitive personal information in notes due to the shared visibility.
Why This Matters
Connecting traffic changes with specific actions taken weeks or months earlier usually means maintaining separate documentation outside Search Console.
Annotations create a change log inside the performance reports you already use.
If you manage multiple properties or work with a larger team, annotations can give everyone a shared record of releases, migrations, and campaigns without relying on external spreadsheets or project tools.
How To Use It
You can add an annotation by right-clicking on a performance chart, selecting “Add annotation,” choosing a date, and entering up to 120 characters of text. The note then appears directly on the chart as a visual reference point alongside clicks, impressions, or other metrics.
Custom annotations are now part of Search Console performance reports and available through the chart context menu.