Unexpected Surge: U.S. Producer Prices Climb 0.4% in August 2026—What’s Fueling the Rise?
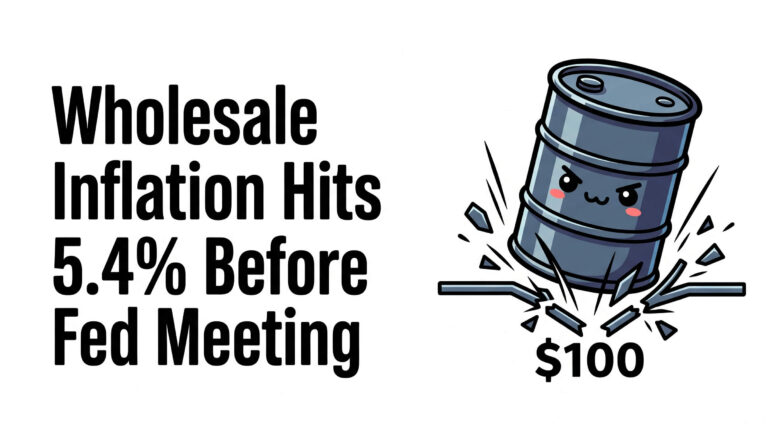
Ever wondered how a sneaky jump in energy prices can ripple through the economy and keep traders biting their nails before a major Fed meeting? Well, August 2026’s U.S. Producer Price Index (PPI) just gave us a front-row seat to that very drama. With wholesale inflation nudging up to 5.4%, barely outpacing economists’ hopes, the real kicker was a 24.1% surge in diesel fuel costs — thank you, Iran war and oil flirting with triple digits! While the headline grabs eyeballs, core PPI whispered a softer tale at 0.2%, setting the stage for some intense market guessing games about what the Fed will do next. Buckle up — this isn’t your average inflation report, and every decimal point could stir the pot in the days ahead. LEARN MORE.
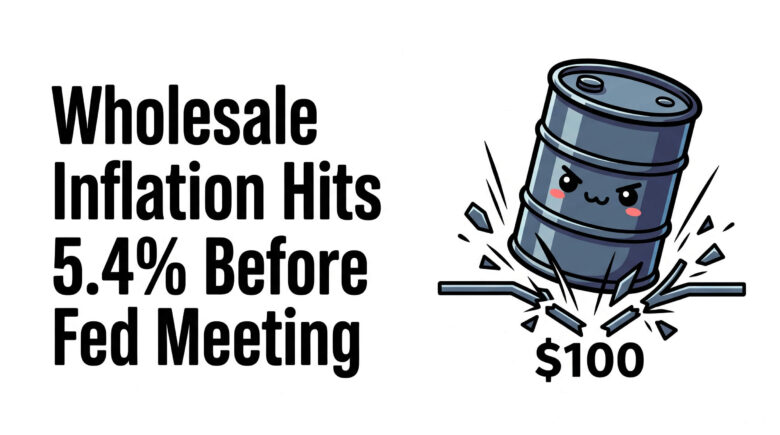
U.S. producer prices rose 0.4% in August 2026, matching forecasts but pushing annual wholesale inflation up to 5.4%. That yearly rate landed just above what economists expected. The catch for traders: energy did most of the lifting, and this print arrived one week before a Fed meeting where every decimal point counts.
U.S. PPI August 2026: Key Takeaways
- Headline PPI: +0.4% month-over-month in August, matching the consensus forecast, after a +0.1% rise in July (revised up from flat)
- Annual PPI: +5.4% for the 12 months through August, up from 4.7% in July and 0.1 point above what economists expected
- Core PPI (ex-food and energy): +0.2% month-over-month, below the 0.3% forecast, though annual core climbed to 4.6%
- Final demand goods jumped 1.1%, with energy prices up 4.2% and diesel fuel alone surging 24.1%
- Processed goods for intermediate demand rose 1.8%, a sign of pipeline pressure building upstream before it reaches consumers
- The report lands one day before August CPI and one week before the September 15-16 FOMC meeting
What Were the U.S. PPI Results for August 2026?
The Producer Price Index measures what producers charge for their goods and services before those costs reach store shelves. Think of it as a preview of inflation, one stage upstream from the prices you pay. In August, the headline number rose 0.4% from July, hitting the forecast on the nose. The annual figure tells a warmer story at 5.4%, up from 4.7% a month earlier and just above expectations.
July’s reading got nudged higher too, from flat to a 0.1% gain. Traders care about revisions because they reshape the trend, and the recent trend points up. Wholesale inflation peaked at 5.9% in May before cooling over the summer. August marks a fresh turn in the wrong direction for anyone hoping price pressure would keep fading.
Why Did Producer Prices Rise? The Role of Energy
Energy carried this report. Prices for final demand goods climbed 1.1%, and the BLS traced over three-quarters of that jump to energy costs, which rose 4.2%. Diesel fuel led the charge with a 24.1% monthly spike. Gasoline, jet fuel, and home heating oil all moved higher alongside it.
The backdrop here is the ongoing Iran war, which pushed global oil back above $100 a barrel this week. President Trump’s escalating trade fight with Canada adds another layer, since new tariffs can filter into wholesale costs. Strip out the volatile food and energy categories and the picture calms down: core PPI rose just 0.2%, coming in under the 0.3% forecast. That gap between the hot headline and the milder core is the whole story for traders trying to read the Fed.
Have a solid trading strategy but lack the capital? When energy shocks and Fed uncertainty crank up volatility, disciplined traders need room to act without risking their own funds. FundedNext provides simulated trading accounts up to $200K, with no artificial time limits on challenges. You even earn a 15% profit share during your evaluation. Once funded, you keep up to a 95% profit split with guaranteed 24-hour payouts, and you can trade CFDs or Futures through major news events like this week’s inflation prints. Join over 400K traders who have received $300M+ in payouts.
Learn More About FundedNext! Limited time offer: Use code BP for discounts on both CFD & Futures plans! T&C apply.
Disclosure: We may earn a commission from our partners if you sign up through our links, at no extra cost to you.
Is Inflation Actually Getting Worse?
The answer depends on which number you trust. Energy is loud and volatile, so a single bad month at the pump can make the headline look alarming without signaling a broader shift. Core PPI, which drops food and energy, gives a cleaner read on underlying pressure, and it came in soft at 0.2%.
The supply chain tells a warmer story. Further upstream, processed goods for intermediate demand rose 1.8%, driven again by diesel. Those are the costs producers pay before goods reach the shelf, and higher input prices can push through to consumers later. Tariffs may also be feeding through at the wholesale level faster than economists first assumed.
What Does the August PPI Report Mean for the Fed?
The timing makes this print matter. Today’s release comes one day before August CPI, and both land just one week before the September 15-16 FOMC meeting. Fed officials have signaled that this week’s inflation data could tip the balance on their next move. A hot headline argues for caution, while the soft core offers cover to hold steady.
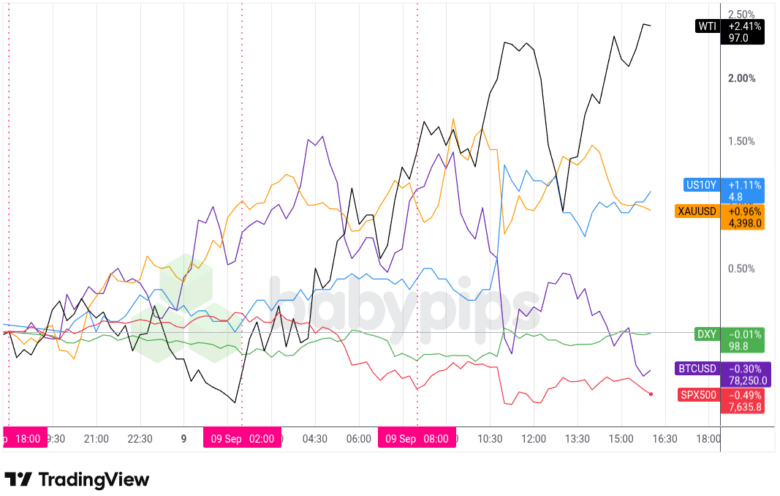
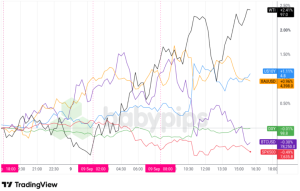
Markets reacted fast. Treasury yields rose and stock futures slipped after the release, a sign traders read the report as reducing the odds of near-term easing. The Fed targets 2% inflation, and a 5.4% wholesale print sits far above that line. Powell’s successor Kevin Warsh has leaned toward a data-driven, cautious stance, so a surprise now looks unlikely until the committee sees the full inflation picture.
Promoted: The Strategy is Half the Battle; Your Mindset is the Rest.
Most trading mistakes aren’t technical, they’re psychological. In the classic “Trading in the Zone” by Mark Douglas (4.7 stars and 10,000+ reviews on Amazon), you’ll learn how to master the probabilistic thinking and emotional discipline that separates consistent traders from the crowd. When a hot headline and soft core pull the market in two directions, hesitation costs money. This is your manual for executing your plan without second-guessing.
Learn more about “Trading in the Zone” by Mark Douglas!
Disclosure: We may earn a commission from our partners if you sign up through our links, at no extra cost to you.
What Does the August PPI Report Mean for USD Traders?
Inflation data drives rate expectations, and rate expectations drive the dollar. A hot producer price print pushes traders to price in a firmer Fed and a stronger USD. That is roughly what happened on release, with yields ticking up and the dollar finding support.
The mixed signal keeps volatility alive into next week. If tomorrow’s CPI confirms the hot-headline, soft-core split, the dollar could stay rangebound as traders wait for the Fed. A clear upside surprise on consumer prices would strengthen the case for a hawkish hold and lift the greenback. For now, energy-driven inflation and the Iran war sit at the center of the dollar story, and both can shift the picture overnight.
Frequently Asked Questions About U.S. PPI
What does the Producer Price Index measure?
The PPI tracks the average change in prices that domestic producers receive for their goods and services. It measures inflation from the seller’s side, one stage before those costs reach consumers. The BLS releases it monthly, and traders treat it as an early warning for where consumer inflation may head.
Why does PPI matter for forex traders?
Producer prices shape expectations for consumer inflation, which in turn shapes what the Fed does with interest rates. Higher rates tend to lift a currency, so a hot PPI often supports the U.S. dollar. The report can move rate expectations in real time, which makes it a high-impact event on the economic calendar.
What happened to U.S. producer prices in August 2026?
Headline PPI rose 0.4% month-over-month, matching the forecast, while the annual rate hit 5.4%, just above expectations. Core PPI excluding food and energy rose a softer 0.2%. A 24.1% surge in diesel fuel prices, tied to the Iran war and oil above $100, drove much of the goods increase.
What is the difference between headline and core PPI?
Headline PPI includes every category, so volatile food and energy prices can swing it sharply from month to month. Core PPI strips those two out to reveal the underlying trend. In August the headline ran hot at 0.4% while core stayed mild at 0.2%, a split that complicates the inflation read.
How could the August PPI affect the Fed’s September decision?
The report came out one day before August CPI, and both arrive one week before the September 15-16 FOMC meeting. The hot headline and soft core pull in opposite directions, which supports a cautious hold rather than a bold move. Fed officials have said this week’s data could prove decisive.
The Iran war, oil above $100, and a Fed decision days away are all pushing on the dollar at once. But most new traders don’t understand how central bank moves ripple through currency markets. Premium members can read our lesson:
How Major Central Banks Influence the Forex Market
Reading this helps you understand why interest rate expectations drive currency values, how inflation data shapes central bank decisions, and how to position yourself when a rate call is around the corner.
And if you’re not a Premium subscriber yet, now’s a good time to join. With BabyPips Premium, you get full access to School of Pipsology lessons that help you understand not just what the data says, but how to trade the consequences before the crowd catches up.









Post Comment