Unexpected Market Shifts on April 15, 2026: What Traders Need to Know Now

Ever wonder how a whisper of peace talks can send shockwaves through Wall Street and beyond? Well, Wednesday’s trading session had me thinking just that—because the S&P 500 didn’t just climb; it sprinted to a new all-time high, fueled by budding optimism over a potential US-Iran ceasefire extension and a surprise uptick in US manufacturing. It’s like the market collectively shrugged off the Strait of Hormuz blockade jitters, letting risk appetite take center stage even as oil prices dipped. Meanwhile, the US dollar played the field with mixed moves, caught in the tug-of-war between geopolitical hope and hard economic facts. Curious to see how all these seismic shifts unfolded and what market whispers are shaping up next? Let’s dive in together. LEARN MORE.
The S&P 500 extended its rally to a fresh all-time high on Wednesday as growing optimism around a potential US-Iran ceasefire extension and a stronger-than-expected US manufacturing report fueled risk appetite. Oil prices declined despite ongoing supply concerns from the Strait of Hormuz blockade, while the US dollar traded mixed as traders weighed geopolitical developments against economic data signals.
Check out the forex news and economic updates you may have missed in the latest trading session!
Forex News Headlines & Data:
- Japan Machinery Orders for February 2026: 24.7% y/y (15.0% y/y forecast; 13.7% y/y previous)
- Reuters Tankan Index for April 2026: 7.0 (15.0 forecast; 18.0 previous)
- France CPI Growth Rate Final for March 2026: 1.7% y/y (1.7% y/y forecast; 0.9% y/y previous)
- Euro area Industrial Production for February 2026: -0.6% y/y (-1.2% y/y forecast; -1.2% y/y previous)
- U.S. MBA 30-Year Mortgage Rate for April 10, 2026: 6.42% (6.51% previous)
- U.S. MBA Mortgage Applications for April 10, 2026: 1.8% (-0.8% previous)
- Canada Wholesale Sales Final for February 2026: 2.0% (2.3% forecast; -1.0% previous)
- Canada Manufacturing Sales Final for February 2026: 3.6% m/m (3.8% m/m forecast; -3.0% m/m previous)
- U.S. Import Prices for March 2026: 2.1% y/y (3.6% y/y forecast; 1.3% y/y previous)
- U.S. Export Prices for March 2026: 5.6% y/y (5.9% y/y forecast; 3.5% y/y previous)
- NY Empire State Manufacturing Index for April 2026: 11.0 (-3.1 forecast; -0.2 previous)
- U.S. NAHB Housing Market Index for April 2026: 34.0 (37.0 forecast; 38.0 previous)
- EIA Crude Oil Stocks Change for April 10, 2026: -0.91M (3.08M previous)
- Fed Beige Book: overall U.S. economic activity was broadly stagnant to only slightly expanding across districts, with many contacts highlighting heightened uncertainty tied in part to ongoing geopolitical tensions and war-related risks. Businesses indicated that consumer spending remained cautious and investment plans restrained, reinforcing expectations that the Fed may lean more toward rate cuts if softness persists into coming months.
Promoted: Day traders & Scalpers have better odds of making great decisions if they see market catalysts right away. Get the real-time feed that pros use to catch the news.
Join FinancialJuice for Free to learn more!
Disclosure: We may earn a commission from our partners if you sign up through our links, at no extra cost to you.
Broad Market Price Action:
Dollar Index, Gold, Oil, S&P 500, U.S. 10-yr Yield, Bitcoin Overlay – Chart Faster With TradingView
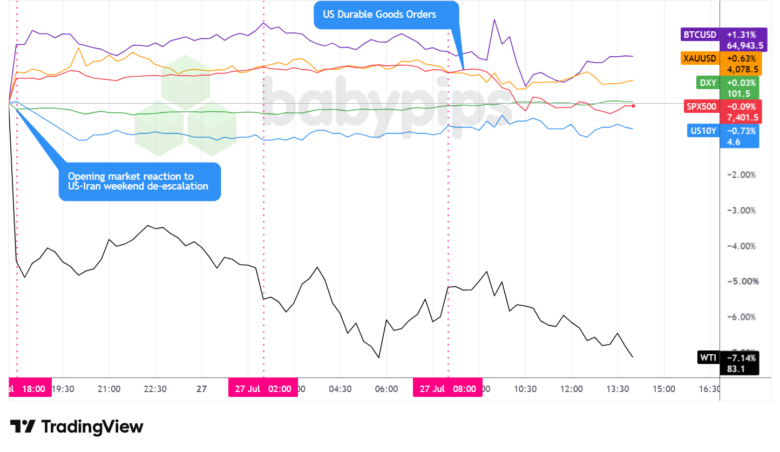
Wednesday’s session reflected a powerful shift in market sentiment as diplomatic signals around the US-Iran conflict overshadowed lingering concerns about energy supply disruptions and inflation risks.
The S&P 500 rallied 0.83% to close at 7,022.6, marking a fresh record high and extending the index’s recovery from March lows. The advance appeared driven by multiple tailwinds: constructive signals on the US-Iran ceasefire extension talks, a strong start to corporate earnings season with financial sector beats from Bank of America and Morgan Stanley, and renewed appetite for technology shares. The tech-heavy Nasdaq 100 outperformed with a roughly 1% gain, with notable strength in Oracle (up 18% on the week), Microsoft and Palantir Technologies (both up 6%). Robinhood Markets surged approximately 10% after receiving SEC approval for sweeping changes to day-trading activity restrictions. The rally comes as the S&P 500 sits just 0.5% away from its late-January record, suggesting markets have largely priced out the geopolitical risk premium built up since the conflict began in late February.
WTI crude oil declined to settle at $87.92 per barrel despite the ongoing US naval blockade of the Strait of Hormuz and Treasury Secretary Scott Bessent’s confirmation that the US would not renew general licenses allowing temporary sales of sanctioned Russian and Iranian crude. The oil weakness likely reflected growing market confidence in a ceasefire extension and potential reopening of the strait, with the front-month May contract experiencing particularly heavy selling pressure. However, crude inventories showed a drawdown of 0.91 million barrels according to the EIA report, suggesting underlying supply tightness persists. With global crude prices still up more than 30% since the war began, the pullback may also represent profit-taking after the recent spike toward $95 per barrel.
Gold fell 0.93% to trade around $4,798.2 per ounce, giving back some of its recent safe-haven gains as optimism around diplomatic progress reduced demand for portfolio hedges. The decline appeared somewhat anomalous given that geopolitical tensions remain elevated with the US blockade still in place and Iran’s military threatening to disrupt all shipping in the Gulf of Oman and Red Sea if the blockade continues. This suggests traders may be positioning for a de-escalation scenario despite the lack of a formal agreement.
Bitcoin advanced 0.83% to close near $75,083, tracking equity market strength as risk appetite returned. The cryptocurrency’s performance aligned with the broader risk-on tone, possibly reflecting its growing correlation with technology stocks and speculative growth assets during periods of improving market sentiment.
Treasury yields climbed 0.66% with the 10-year yield rising to approximately 4.279%. The bond market move likely correlated with the equity rally and reduced safe-haven demand, as diplomatic optimism and strong corporate earnings overshadowed concerns about persistent inflation and elevated energy prices. The yield increase also followed a softer-than-expected import price report showing March import prices rising just 0.8% month-over-month versus the 1.9% forecast, which may have reduced some near-term inflation concerns despite the ongoing energy supply disruptions.
Promoted: Capitalize on the Macro Pivot.
Wednesday’s risk-on rally proved exactly how fast diplomatic headlines can dictate the tape. As the S&P 500 surged to fresh record highs and oil retreated on US-Iran ceasefire hopes, traders who correctly anticipated the geopolitical shift were heavily rewarded.
If you nailed that read but lacked the capital to maximize the move, you left money on the table.
That’s where Tradeify comes in. Their Lightning accounts provide instant funding with zero evaluation phase. When the next major macroeconomic catalyst hits—like Thursday’s heavy Chinese data dump or the ECB minutes—make sure you’re executing with the buying power your edge demands.
Get Instant Funding with Tradeify!
Disclosure: We may earn a commission from our partners if you sign up through our links, at no extra cost to you.
FX Market Behavior: U.S. Dollar vs. Majors
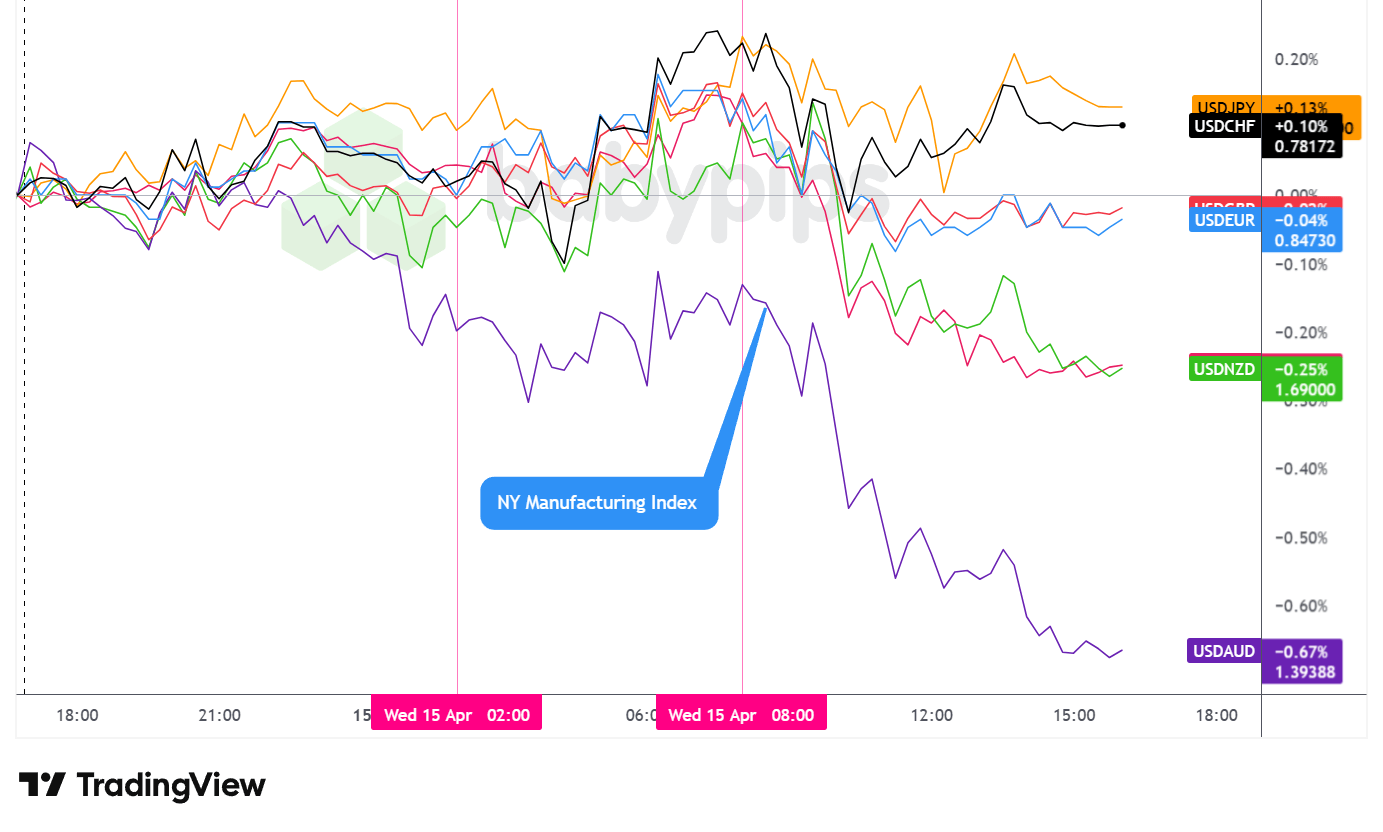
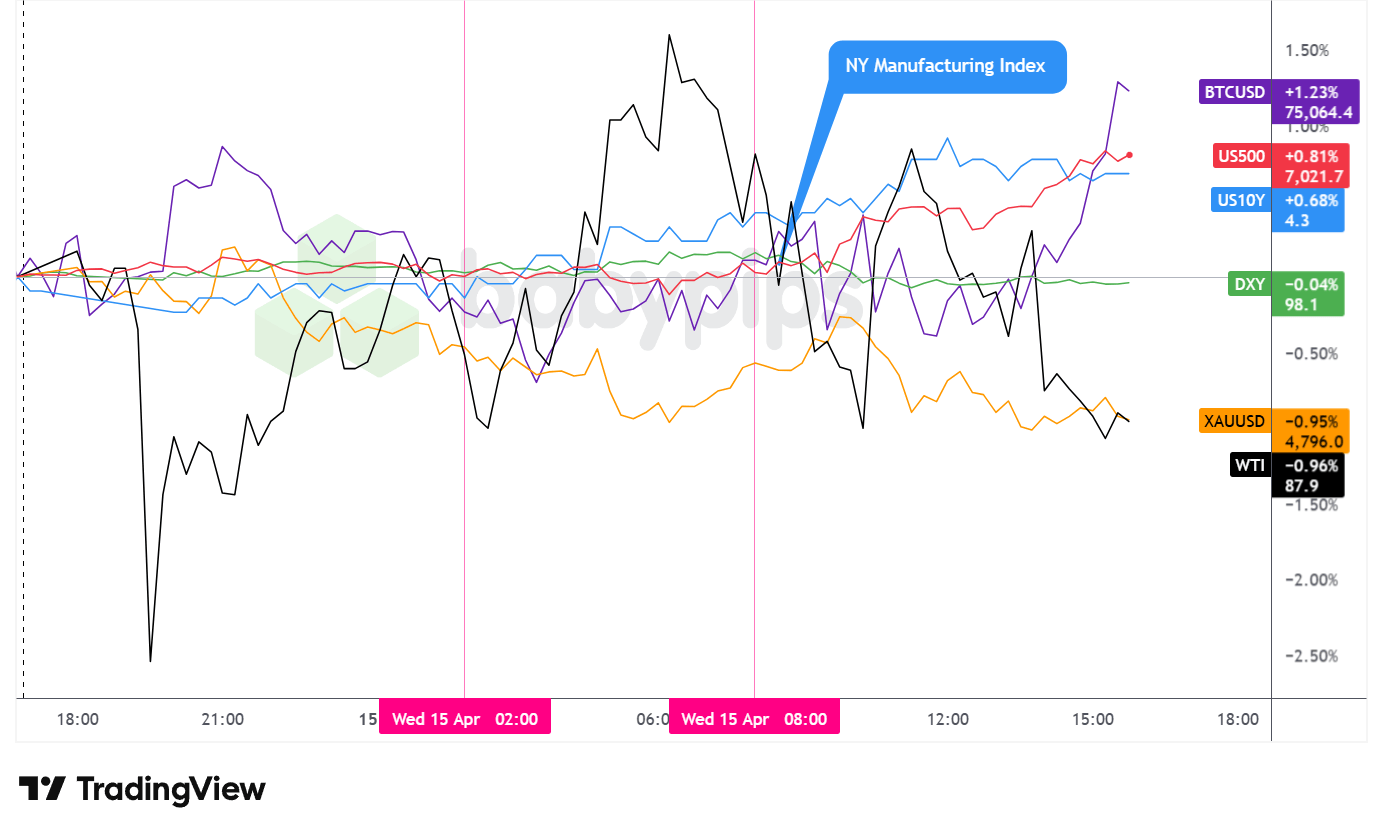
Overlay of USD vs. Majors – Chart Faster With TradingView
The U.S. dollar traded with mixed performance across the Wednesday session, closing with a net bearish lean against most major currencies as traders appeared to prioritize diplomatic optimism and risk appetite over safe-haven positioning.
During the Asian session, the U.S. dollar traded choppy and mostly sideways with an arguably net slightly bullish lean overall. With no major regional economic data releases, the modest dollar firmness likely reflected overnight positioning as markets digested the ongoing US-Iran ceasefire (now in its seventh consecutive day) and mixed signals from President Trump, who characterized the war as “very close to over” while stressing that operations are not yet complete. The tepid Asia session price action suggested traders were awaiting clearer catalysts from the European and US sessions.
The London session brought an arguably net bullish move for the dollar during the morning hours, as it dipped initially before rebounding against the major currencies heading into the US session open. Economic data showed mixed signals: Japan’s Reuters Tankan survey revealed a sharp drop in manufacturing sentiment to 7.0 from 18.0, marking the steepest decline in three years and highlighting the impact of higher energy costs from the Iran conflict. Japan’s machinery orders, however, beat expectations with a 13.6% month-over-month gain. Eurozone industrial production came in slightly weaker than forecast at 0.4% versus 0.5% expected, while France’s final inflation data confirmed expectations at 1.7% year-over-year. The dollar’s resilience during this session despite the lack of major US-specific catalysts suggested underlying safe-haven demand remained supported by the uncertain geopolitical backdrop.
After the Wednesday US session opened, the US dollar saw selling pressure right away, which continued through the end of the London session. The weakness appeared to correlate with improving risk sentiment as equity markets rallied and reports emerged that the US and Iran are considering a two-week ceasefire extension. However, the NY Empire State Manufacturing Index delivered a significant positive surprise, jumping to 11.0 versus the -3.1 forecast and -0.2 previous reading. Despite this strong economic data, the dollar failed to capitalize, suggesting that the dominant market narrative centered on de-escalation hopes rather than US economic strength. Import and export prices also came in softer than expected, possibly adding to the dollar’s struggles by reducing near-term inflation concerns.
After the London session closed, the US dollar stabilized and traded mixed against the major currencies until the Wednesday close. The NAHB Housing Market Index disappointed at 34.0 versus 37.0 expected, and the EIA crude oil inventory report showed a modest drawdown. The Fed Beige Book release in the afternoon likely provided additional context on regional economic conditions, though its impact on currency markets appeared limited given the stronger geopolitical narrative.
Upcoming Potential Catalysts on the Economic Calendar
- Australia Consumer Inflation Expectations for April 2026 at 1:00 am GMT
- Australia Employment Situation Update for March 2026 at 1:30 am GMT
- China GDP Growth Rate for March 31, 2026 at 2:00 am GMT
- China Unemployment Rate for March 31, 2026 at 2:00 am GMT
- China Industrial Production for March 2026 at 2:00 am GMT
- China Retail Sales for March 2026 at 2:00 am GMT
- ECB Lane Speech at 3:40 am GMT
- U.K. Manufacturing & Industrial Production for February 2026 at 6:00 am GMT
- U.K. GDP for February 2026 at 6:00 am GMT
- Swiss Producer & Import Prices for March 2026 at 6:30 am GMT
- SNB Monetary Policy Meeting Minutes at 7:30 am GMT
- Euro area CPI Growth Rate Final for March 2026 at 9:00 am GMT
- ECB Monetary Policy Meeting Accounts at 11:30 am GMT
- Canada New Motor Vehicle Sales for February 2026 at 12:30 pm GMT
- U.S. Philadelphia Fed Manufacturing Index for April 2026 at 12:30 pm GMT
- U.S. NY Fed Services Activity Index for April 2026 at 12:30 pm GMT
- U.S. Initial Jobless Claims for April 11, 2026 at 12:30 pm GMT
- Fed Williams Speech at 12:35 pm GMT
- ECB Schnabel Speech at 1:00 pm GMT
- U.S. Industrial & Manufacturing Production for March 2026 at 1:15 pm GMT
Thursday’s calendar features a heavy concentration of Chinese economic data overnight, including first-quarter GDP growth and March industrial production and retail sales figures, which could provide insight into how the world’s second-largest economy is managing elevated energy costs from the Iran conflict. Australian employment data will also be closely watched as markets assess labor market resilience in commodity-exporting economies.
The European session brings UK manufacturing and GDP data for February, along with Swiss National Bank policy meeting minutes and eurozone final inflation figures. ECB Monetary Policy Meeting Accounts could offer additional context on the central bank’s inflation assessment and policy outlook given recent energy price pressures.
US session highlights include the Philadelphia Fed Manufacturing Index and NY Fed Services Activity Index, which will provide broader regional perspectives following Wednesday’s strong NY Empire State Manufacturing surprise. Initial jobless claims will be monitored for any signs of labor market deterioration amid the ongoing geopolitical uncertainty. Fed Williams’ scheduled speech could offer further policy guidance, while US industrial production data will round out the session’s economic calendar.
Markets remain highly sensitive to any fresh developments on the US-Iran ceasefire extension talks, with the current truce set to expire next Tuesday. Reports suggest mediators are seeking to arrange technical discussions to resolve contentious issues including the reopening of the Strait of Hormuz and Iran’s nuclear program, though significant gaps remain.
Stay frosty out there, forex friends!
Promoted: The Strategy is Half the Battle; Your Mindset is the Rest.
Most trading mistakes aren’t technical—they’re psychological. In the classic “Trading in the Zone” by Mark Douglas (⭐ 4.7★ | 10,000+ reviews on Amazon), you’ll learn how to master the probabilistic thinking and emotional discipline needed to manage risk. If you struggle with hesitation or breaking your rules, this is your manual for consistent execution.
Click on the link to learn more about “Trading in the Zone” by Mark Douglas!
Disclosure: To help support our content, we may earn a commission from our partners if you sign up through our links, at no extra cost to you.