Silver’s Sudden Plunge: Is the Fed’s Hawkish Stance or Hormuz Threat the Real Game-Changer?

Ever wonder why silver’s price swings can feel like riding a rollercoaster with no seatbelt? If you’re trading XAG/USD, silver CFDs, futures, or ETFs, this past week delivered a wild tale—silver started strong but took a nosedive midweek, thanks to hawkish rate expectations and a dollar flexing its muscles. By the end, silver clawed back some ground but still ended notably lower. Curious how geopolitical chess moves, Fed whispers, and industrial demand all tango to shape silver’s fate? Stick around as we unpack the shocks, rebounds, and what’s lurking on the horizon that might just make your portfolio hold its breath again. LEARN MORE.
If you trade XAG/USD, silver CFDs, silver futures, or silver ETFs, here’s what moved silver this week and what to watch next week.
Silver opened the week at $64.85 and dropped nearly 12% over Tuesday and Wednesday under hawkish rate expectations and a stronger dollar. PCE came in line with consensus on Thursday, the dollar fell, and silver recovered.
Silver closed the week at $59.45, down 8.78%.
The Week in Review
Let’s take a look at what silver did this week.
Monday: Iran Deal, Modest Gain
US-Iran talks in Switzerland produced a 60-day peace roadmap. Oil sold off, easing inflation concerns and taking some pressure off the rate-hike outlook.
Silver gained 0.40% to $65.10. The dollar topped all major currencies that session. Last week’s hawkish FOMC under Chair Warsh kept real yields elevated.
Tuesday–Wednesday: The Two-Day Collapse
Both sessions moved for the same reason: hawkish Fed positioning raised real yields, which strengthened the dollar, which pressed silver lower.
Silver fell 5.41% on Tuesday to $61.58. Then 6.75% on Wednesday to $57.42. Tuesday and Wednesday combined: down 11.8%.
Thursday: Dollar Reverses
Core PCE came in line with consensus and didn’t force fresh hawkish repricing. Yields drifted lower and the dollar fell. Silver gained 0.81% to $57.89.
Friday: Dollar Weakness Continues
Dollar weakness from Thursday carried into Friday. Silver gained 2.18% to $59.45.
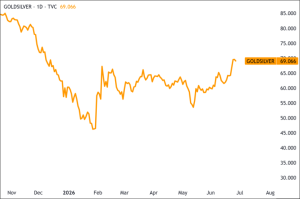
The Gold/Silver Ratio
The gold/silver ratio, which measures how many ounces of silver it takes to buy one ounce of gold, widened from 64 last week to 69 this week.
Gold fell 1.60% on the week. Silver fell 8.78%.

Both metals respond to the same forces: real rates, the dollar, and rate expectations.
Silver moves more in both directions because it trades in a thinner, more speculative market than gold. It also carries real industrial demand from solar panels, EVs, and electronics, which ties its price to economic cycles in a way gold doesn’t.
When rate expectations shift hawkish, silver falls harder. This week confirmed that.
Managed Money Positioning
Managed money refers to large hedge funds and institutional traders who bet on silver futures.
The most recent CFTC Commitment of Traders report shows managed money holding 17,559 long contracts and 5,818 short contracts, a net long of 11,741 contracts.
That’s down roughly 1,200 from the prior week’s net long of approximately 12,957 contracts.
Positioning is light, with no crowded long that could trigger a cascade of forced selling. This week’s move was macro-driven, not positioning-driven.
The COT data is from Tuesday, before Wednesday’s –6.75% session and Thursday/Friday’s recovery. The actual positioning shift by week’s end won’t show until next week’s report.
Technical Backdrop
The chart shows a sustained downtrend from the January 2026 high, with lower highs throughout. This week extended that structure with a new low.
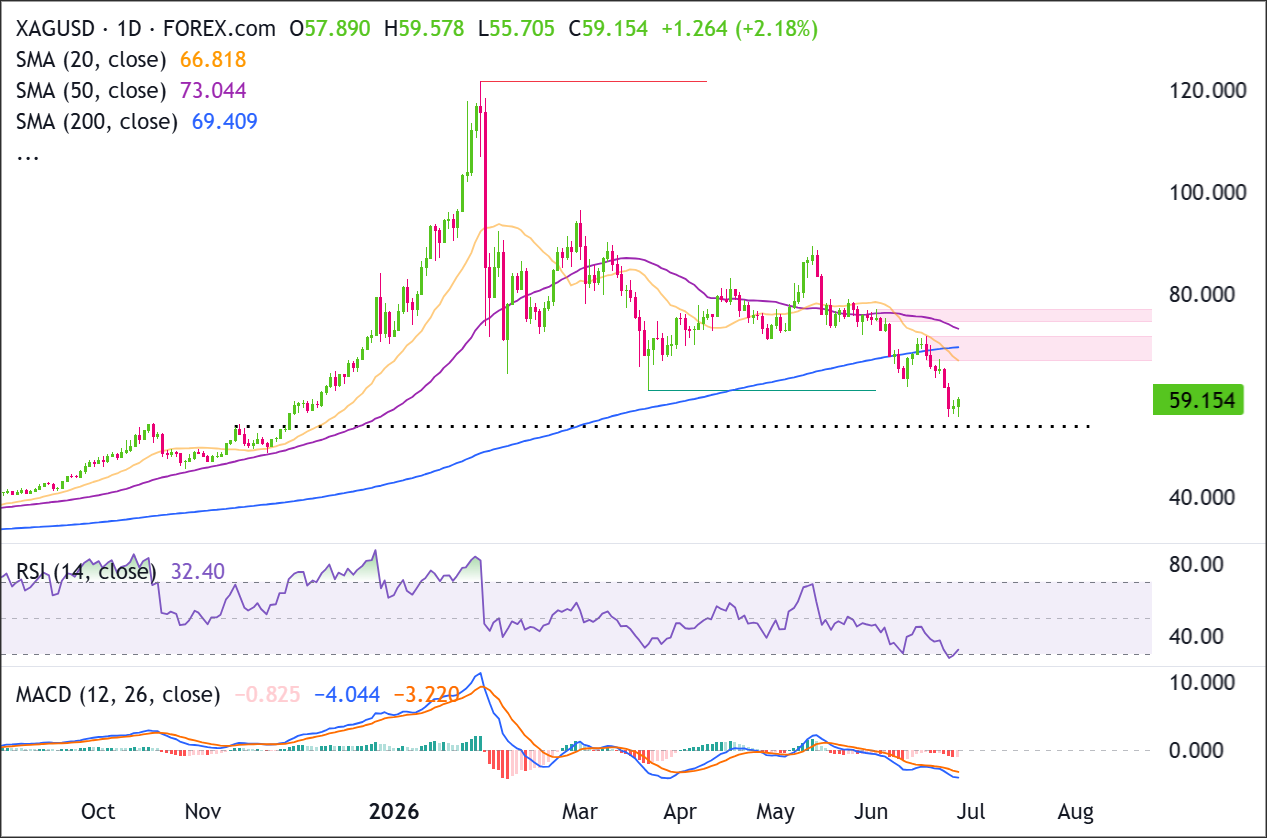
Recent Price Action
Recent price action shows a sharp selloff into 55.000-56.000, followed by a rebound to 59.154.
Buyers are attempting to defend the prior support area, but price still needs to reclaim 66.800-69.400 to repair the short-term structure.
Sellers still have control unless price can build a higher low above 55.000-56.000.
Moving Averages
The 20 SMA sits at ~$66.818, declining, and is the nearest moving average above Friday’s close. At roughly $7.70 above current price, it’s the first level bulls need to close above to signal that short-term selling pressure is easing.
The 200 SMA sits at ~$69.409 and still has a slight upward slope on the chart, a carry-over from the bull run that preceded this year’s selloff. It sits between the 20 and 50 SMAs by price, making it the second hurdle on any recovery attempt.
The 50 SMA sits at ~$73.044, declining, and is roughly $13.90 above Friday’s close. Together with the 200 SMA, it forms the primary overhead resistance any sustained recovery would need to work through.
Price is below all three moving averages. The 200 SMA has flipped from a potential support level to resistance since price broke beneath it.
Momentum
The RSI sits at 32.40, approaching but not yet at oversold territory, which begins below 30.
At this level, sellers still have room to push price lower before RSI signals an extreme. A reading below 30 would suggest the selloff has reached a level where buyers tend to step in.
The MACD and signal lines remain negative, and the histogram widened over the week as selling built momentum. It began to narrow late in the week as the recovery sessions reduced downside momentum, but remains negative.
If you’re watching momentum, a narrowing histogram while the MACD is still negative means selling pressure is easing but hasn’t reversed.
Key Support & Resistance Levels
The table below shows the key price references above and below Friday’s close.
| Level Type | Price Zone | Technical Significance |
|---|---|---|
| Major Resistance | $73–$75 | 50 SMA at ~73.044, declining. A significant ceiling on any sustained rally. |
| Secondary Resistance | ~$69.409 | 200 SMA. Price is more than $10 below it. Reclaiming this level is the first structural requirement. |
| Immediate Resistance | ~$66.818 | 20 SMA, declining. The first moving average to clear on any recovery attempt. |
| Current Price | $59.154 | Friday’s close. Below all three moving averages. |
| Immediate Support | ~$55.7 | This week’s intraday low. Where buyers stepped in Friday and pushed price back to close. |
| Psychological Support | ~$50 | Round number below this week’s low. Next major reference if $55.7 breaks. |
Current Market Conditions at a Glance
Everything we just covered, in one place.
| Indicator | Reading | What It’s Telling You |
|---|---|---|
| XAG/USD Close | ~$59.45 | Down 8.78% on the week. |
| Distance from ATH ($121.67) | ~51.1% below | Deep in correction territory. Price is roughly half the January 2026 high. |
| 200 SMA | ~$69.409 | More than $10 above current price. Overhead resistance. Reclaiming it is the first technical requirement. |
| 50 SMA | ~$73.044 | Declining and well above price. Significant ceiling on any rally attempt. |
| RSI (14-day) | 32.40 | Near oversold but not there. Room for further selling before the indicator signals exhaustion. |
| MACD | Bearish | Histogram widened over the week but began narrowing late. Selling pressure easing but not reversed. |
| Gold/Silver Ratio | 69 | Widened from 64 last week. Silver underperformed gold significantly. |
| Managed Money Positioning | Net long ~11,741 contracts (June 23 data) | Light positioning. Managed money was reducing longs heading into the week. |
| Brent Crude | $71.99 | Oil dropped sharply on the Iran deal early in the week. |
| Fed Rate Expectations | ~60% odds of September hike | Nine of nineteen FOMC members projecting a 2026 hike keeps pressure on silver via elevated real yields. |
| Next Key Events | Iran/Hormuz (ongoing); NFP July 2, 8:30 a.m. ET | Hormuz could move silver any session. NFP is the next scheduled binary catalyst. |
The Big Thing to Watch
Two catalysts will drive silver next week: the Strait of Hormuz situation, which can move any session without warning, and NFP on July 2.
Iran and the Strait of Hormuz
The situation escalated sharply over the weekend. Both the US and Iran launched strikes, the worst escalation since the interim peace deal was signed two weeks ago, and a tanker was struck by a projectile in the waterway on Saturday. Each side accused the other of violating the agreement.
The interim deal that sent oil lower at the start of this week is now under serious strain. If the waterway closes or fighting continues, oil moves higher, rate-hike pressure builds, and silver faces renewed headwinds.
Watch how this develops before sizing into positions for next week.
NFP
The June jobs report drops Thursday, July 2, at 8:30 a.m. ET and is the week’s scheduled anchor.
- A strong print reinforces rate-hike expectations, raises real yields and the dollar, and keeps pressure on silver.
- A weak print eases rate-hike expectations and could let silver push back toward the moving averages.
Rate-hike odds sit at 60% for September. NFP is the number most likely to move that probability in either direction next week.
Key Levels to Watch
If you’re looking to go long, wait for a confirmed daily close above the 20 SMA (~$66.818) with follow-through in the next session. A weak NFP print is the most likely catalyst for that opening.
If you’re already long, the 20 SMA (~$66.818) is your line. A close above it means short-term selling pressure is easing. A reversal before reaching it confirms overhead resistance and puts this week’s low (~$55.7) back in play.
If you’re looking to go short, the setup is a break below ~$55.7 that holds for a full session. That level is this week’s intraday low, and where buyers stepped in on Friday, so it’s a tested level. A strong NFP print is the most likely catalyst to push through it. If $55.7 gives way, $50 is the next reference.
If you’re already short, the 20 SMA (~$66.818) is your invalidation level. A daily close above it means short-term selling pressure is easing and the short thesis no longer holds.


Post Comment