NZD/USD Faces Critical Test: Will It Break Free or Plunge Back?
Well, would ya look at that—Kiwi’s been busy lately, pushing the NZD/USD pair right up against a critical resistance zone. So here’s the million-dollar question that’s got traders twitching: are we standing on the brink of a clean breakout, or will the tenacious Kiwi bears hold their ground just a bit longer? With the RBNZ hinting that its easing cycle might finally be winding down—coupled with retail sales that didn’t just meet but exceeded expectations—it’s no wonder the dollar’s been snagged up faster than a Black Friday deal. Meanwhile, the US dollar’s caught in a bit of a lull, more folks betting on a December rate cut than banking on a rally. But this isn’t just about numbers—it’s a fascinating chess match unfolding at the .5700 psychological threshold, where the interplay of Fibonacci retracements, moving averages, and channel tops all converge. Whether you’re rooting for bulls to smash through or bears to push back, one thing’s for sure: the coming days could be pivotal. Ready to dive deeper into what might happen next? LEARN MORE.
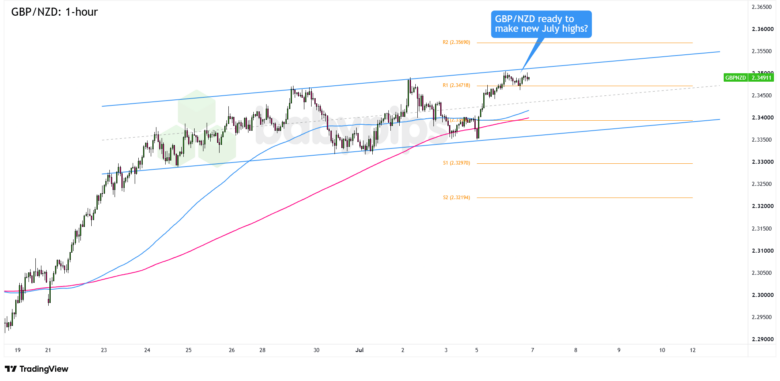
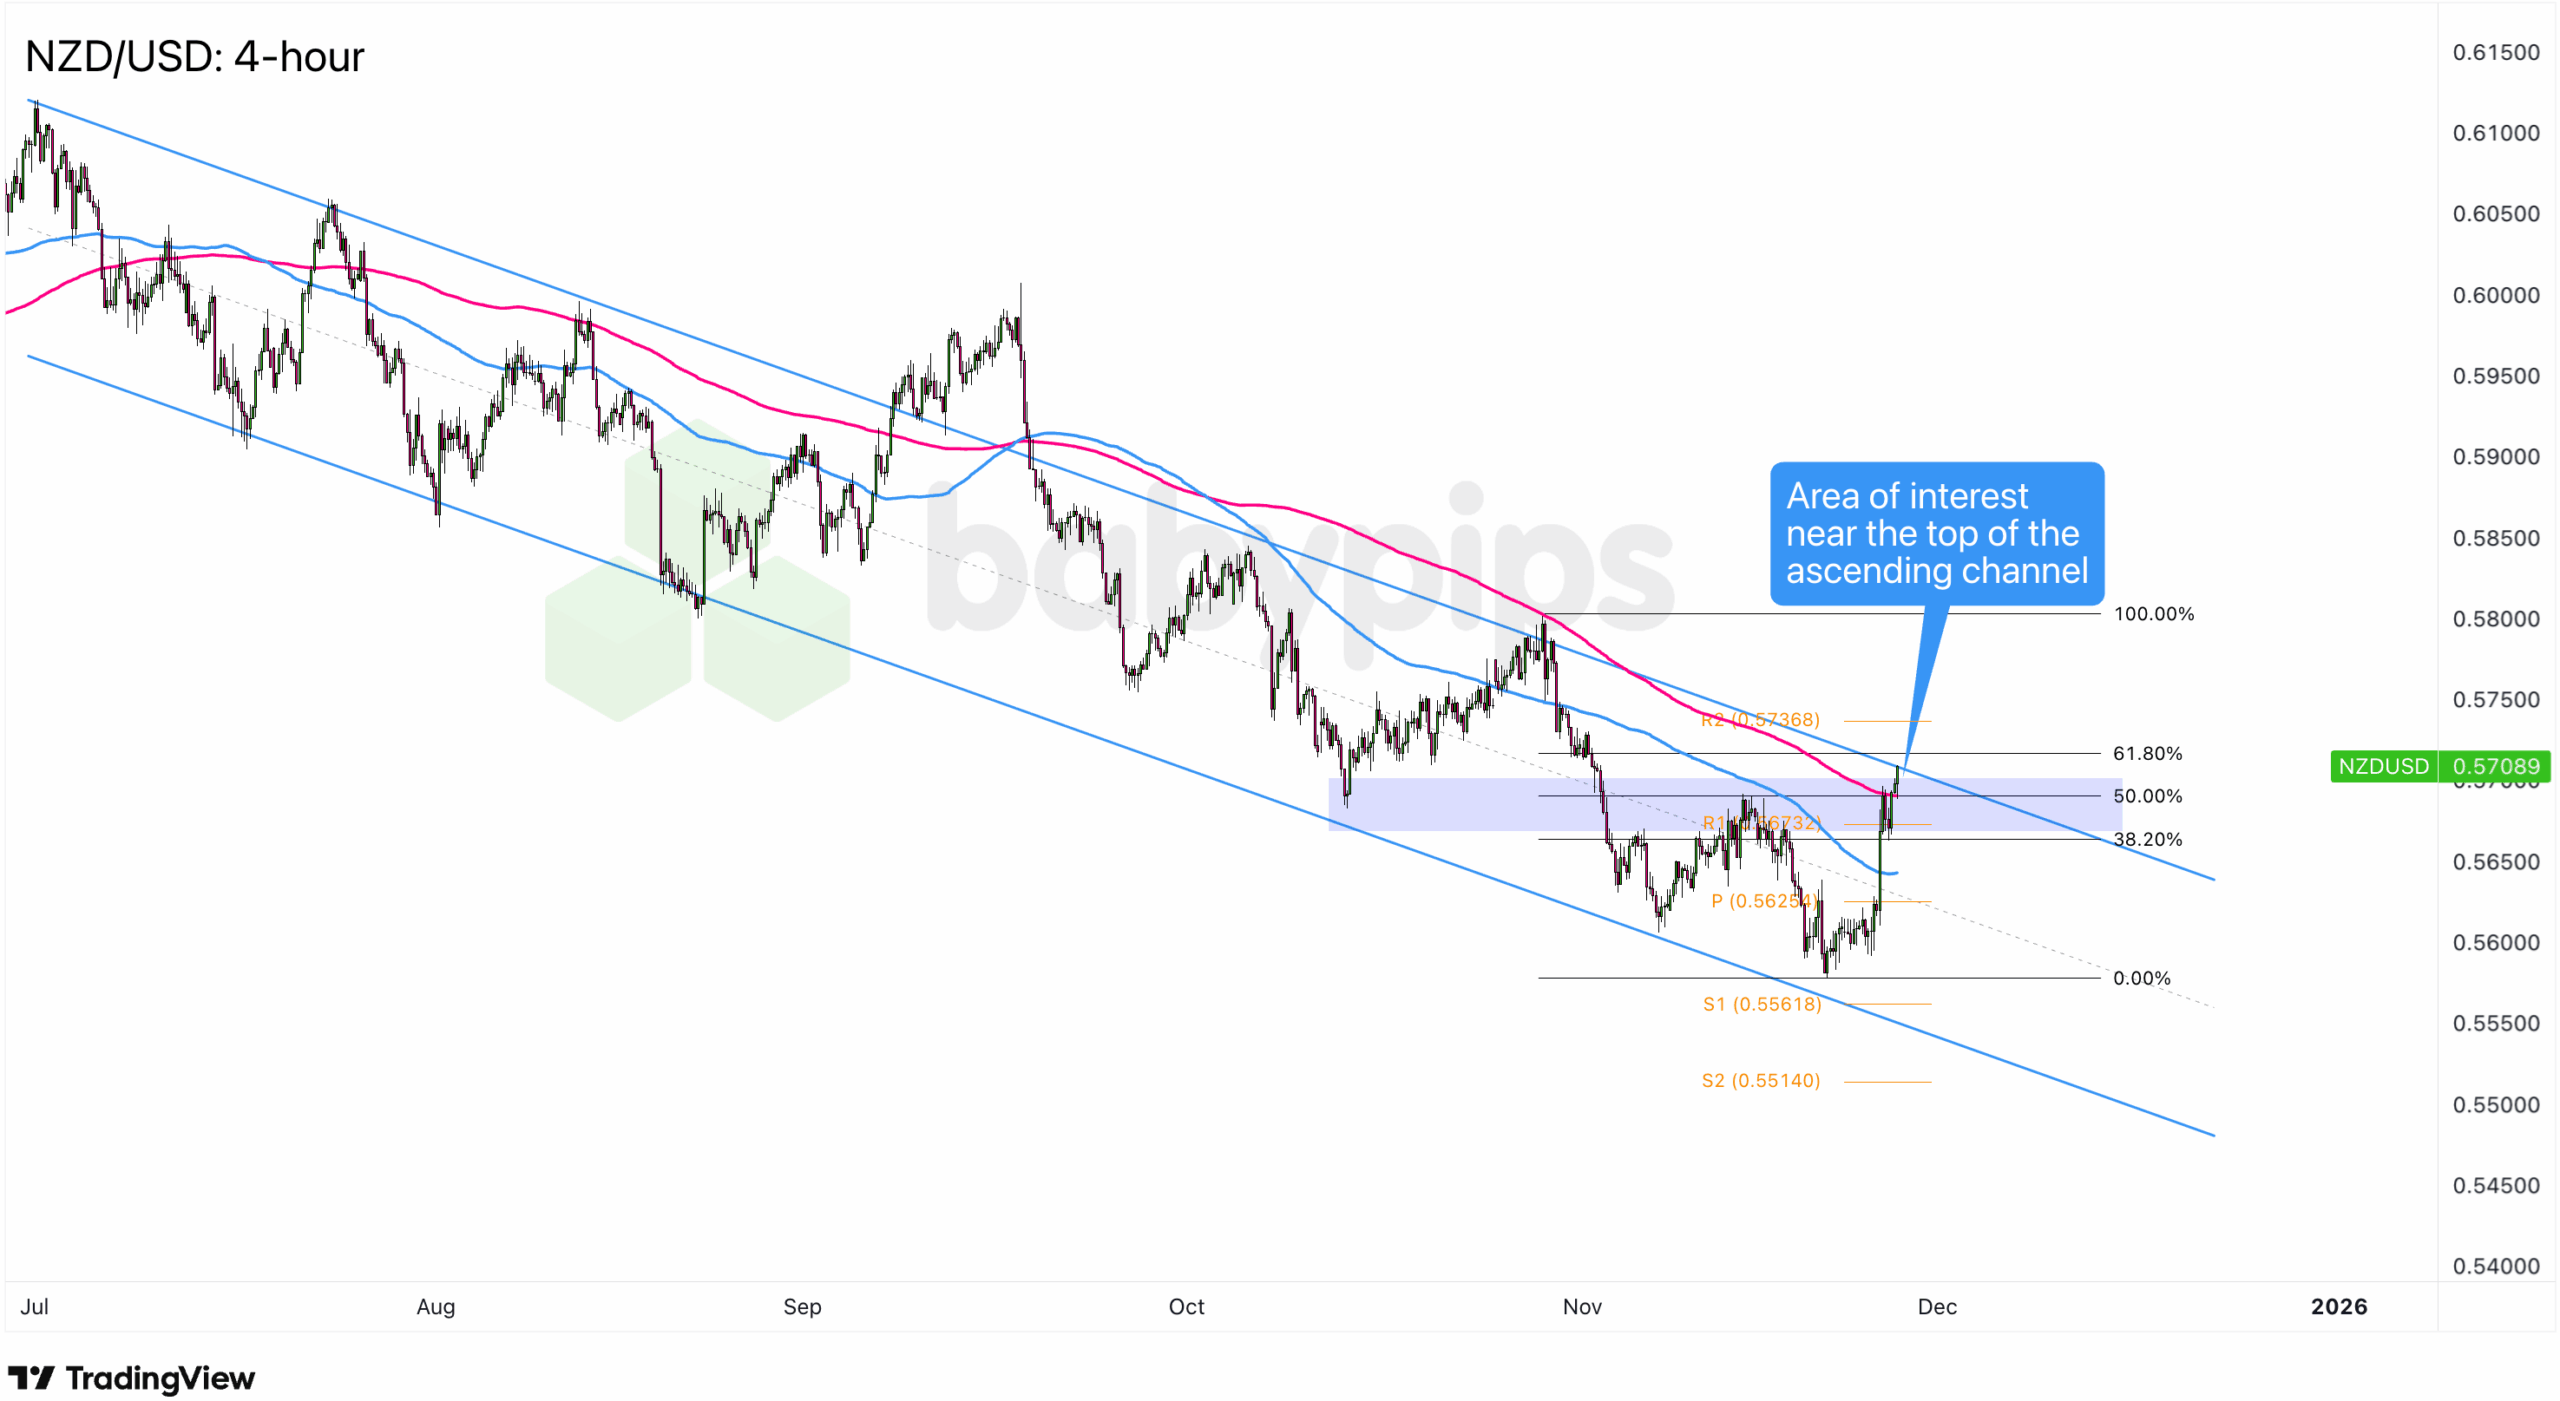
Kiwi’s recent gains got NZD/USD knocking on a key resistance zone!
Think we’ll see an upside breakout this week?
Or will Kiwi bears defend the resistance area for another day?

NZD/USD 4-hour Forex Chart by TradingView
RBNZ’s signals that its easing cycle may be wrapping up, paired with stronger-than-expected quarterly retail sales, had traders scooping up the New Zealand dollar like it was on sale.
The U.S. dollar, meanwhile, is struggling to build real momentum as more traders lean into expectations for a December Fed rate cut.
Remember that directional biases and volatility conditions in market price are typically driven by fundamentals. If you haven’t yet done your fundie homework on the New Zealand dollar and the U.S. dollar, then it’s time to check out the economic calendar and stay updated on daily fundamental news!
NZD/USD, which has been trending lower since July, is now hovering near the .5700 psychological level after climbing roughly 120 pips from its November lows.
More importantly, the pair is pressing right into a loaded technical zone that includes the 50% Fibonacci retracement of the early November downswing, the 200 SMA, and the top of the ascending channel pattern that has guided the broader downtrend.
A few more bullish candlesticks could finally crack the bearish structure and open the door for a move toward the .5750 or .5800 previous areas of interest.
But if NZD/USD starts printing bearish candles or struggles to hold above .5700, the pair could roll over again and head back toward the .5600 previous lows, if not new November lows.
Whichever bias you end up trading, don’t forget to practice proper risk management and stay aware of top-tier catalysts that could influence overall market sentiment.
Disclaimer:
Please be aware that the technical analysis content provided herein is for informational and educational purposes only. It should not be construed as trading advice or a suggestion of any specific directional bias. Technical analysis is just one aspect of a comprehensive trading strategy. The technical setups discussed are intended to highlight potential areas of interest that other traders may be observing. Ultimately, all trading decisions, risk management strategies, and their resulting outcomes are the sole responsibility of each individual trader. Please trade responsibly.