Bitcoin Plummets Below $76,000 Amid Chip Stock Collapse—Is a Crypto Crisis Unfolding?
Why did crypto take a nosedive today? Picture this: Bitcoin plunging 6% below the $76,000 mark right after a brutal Wall Street chip-stock meltdown. Over a billion bucks in leveraged bets got wiped out, with a hefty $430 million fleeing Bitcoin ETFs—talk about a market mood swing. The panic didn’t just stop there; it seeped through Ethereum, XRP, Solana, and beyond, dragging the Crypto Fear & Greed Index down to 28, signaling serious jitters. So, what’s behind this domino effect starting from chipmakers and rippling through tech stocks into crypto chaos? And more intriguingly, can Bitcoin find its footing before things get even more chaotic? If you’ve been scratching your head wondering why your crypto portfolio is suddenly sweating bullets, you’re not alone. Dive into the tangled web of stock routs, political shifts, and leveraged liquidations shaking up the digital currency seas right now. LEARN MORE.
Short answer to “why is crypto down today?” Bitcoin fell 6% to below $76,000 after a Wall Street chip-stock crash on Thursday, November 5, wiped out $1.03 billion in leveraged bets and pulled $430 million out of Bitcoin ETFs. The selling hasn’t stopped overnight.
Bitcoin traded at about $75,700 on Binance on Friday morning, down from $80,547 at the start of Thursday. Ethereum lost 8.2% to $2,218, XRP fell 9.7% to $1.18 and Solana dropped 6.9% to $89.22. The Crypto Fear & Greed Index fell to 28, in “Fear”, from a neutral 50 a day earlier.
The trigger came from stocks. The Philadelphia Semiconductor Index closed down 12.2%, its members Nvidia and AMD lost 9.3% and 17.3%, and the Nasdaq fell 5.5%. Crypto stocks went with them: Strategy dropped 9.3% and Coinbase 9.7%.
So what turned a tech sell-off into a crypto crash, and where can Bitcoin find a floor?
Today was a 4σ day for equities. The S&P 500 fell 4.4% and the Nasdaq fell 5.5%, a decline seen roughly once every 19 months. Bitcoin fell about 5%. $STRC closed at $99.56, just 44 cents below par.
— Michael Saylor (@saylor) November 5, 2026
Market Intelligence: Crypto Analyst Predicts Best Low-Cap Crypto
Why Is Crypto Down Today? A Chip Sell-Off Meets Leverage
Wall Street opened at 14:30 UTC, and Bitcoin broke within the hour. The 15:00 UTC candle on Binance fell from $78,288 to $75,568, the day’s busiest hour with $513 million traded.
Yahoo Finance’s market coverage linked the stock rout to the Democrats’ clear midterm win and what it could mean for AI infrastructure spending and its regulation. Chipmakers, the biggest winners of the AI trade, took the hardest hit.
Leverage did the rest. CoinGlass counted $1.03 billion in liquidations over 24 hours, positions closed by force when margin ran out. Longs made up $924.94 million of that, or 89.4%, across 199,365 traders.
Bitcoin longs lost $255.88 million and Ether longs $163.83 million. The biggest single wipeout was a $10.94 million ETHUSDT position on Binance.
DISCOVER: Trump Media Moves $344 Million in Bitcoin to Crypto.com as TRUMP Hits a Record Low
How Much Did Bitcoin ETFs Lose?
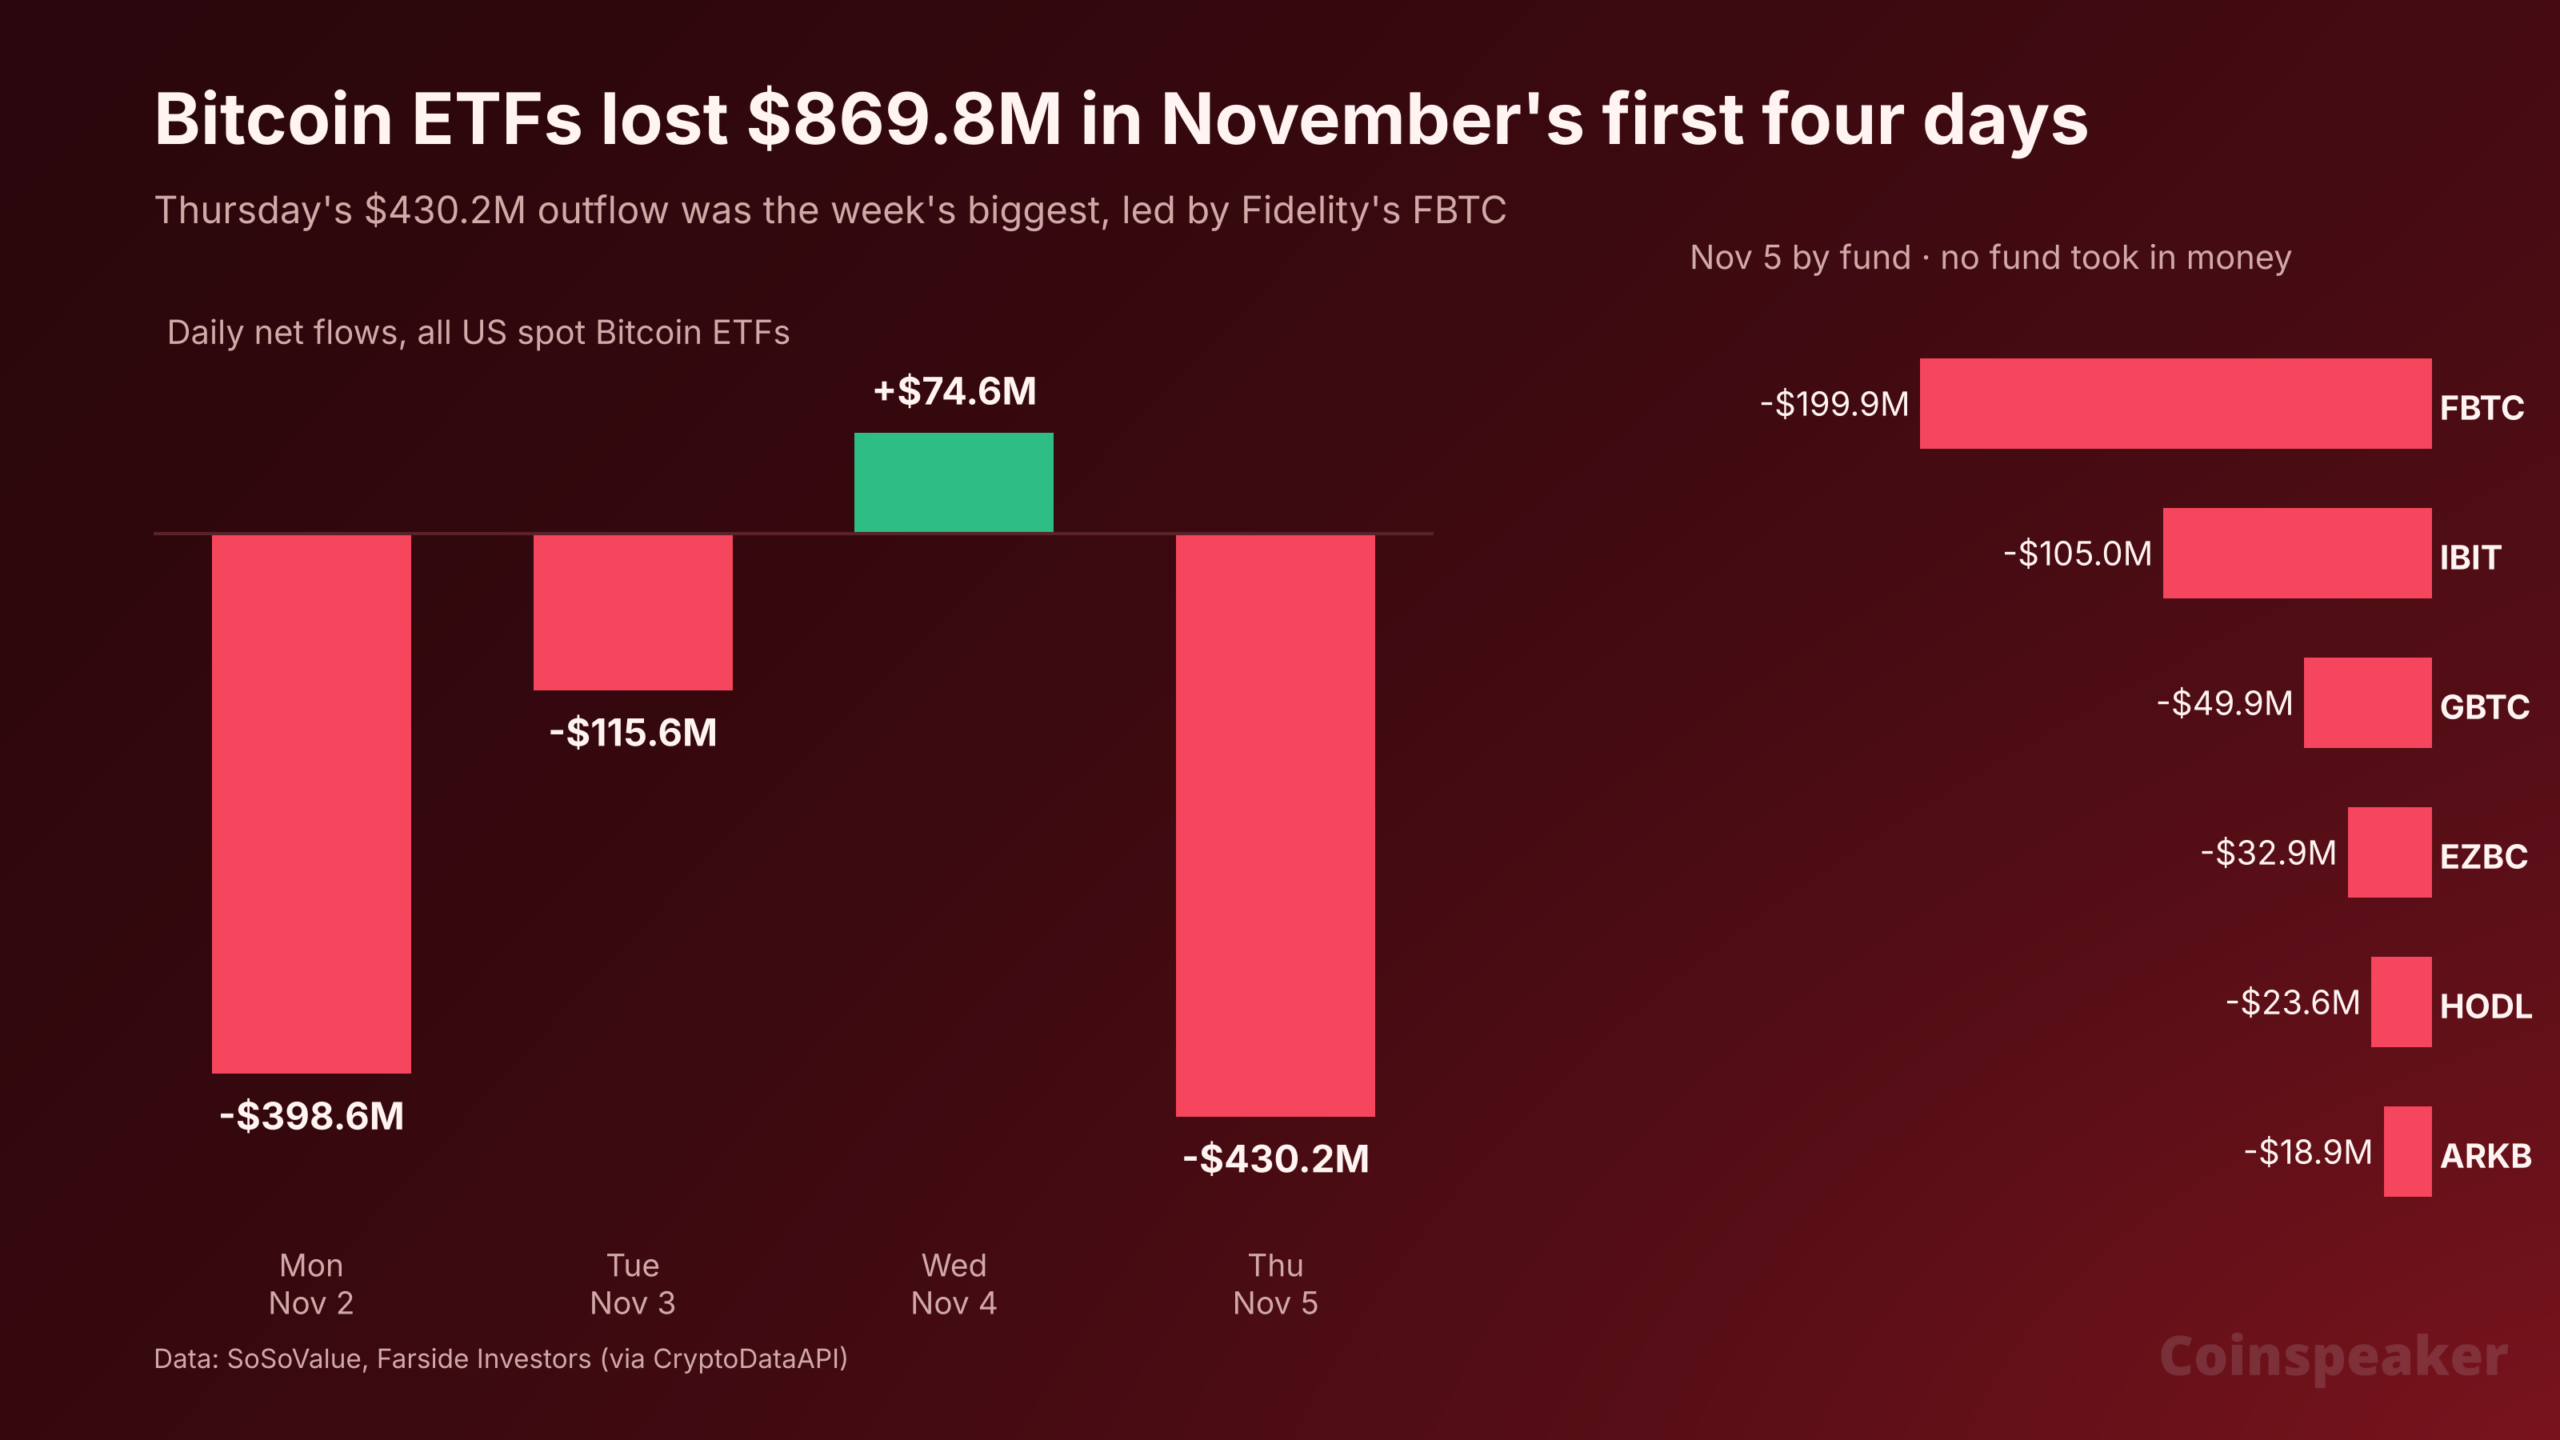
US spot Bitcoin ETFs saw $430.2 million in net outflows on Thursday, and not one of the 12 funds took in money. SoSoValue’s ETF tracker shows Fidelity’s FBTC led with $199.87 million out, ahead of BlackRock’s IBIT at $104.97 million.

Grayscale’s GBTC lost $49.90 million, Franklin Templeton’s EZBC $32.92 million, VanEck’s HODL $23.64 million and ARKB $18.90 million.
It undid Wednesday in one session. Funds had added $74.6 million on November 4, the only inflow day so far this month. November’s first four trading days now add up to $869.8 million in outflows, on top of $515.9 million that left in October.
Fidelity’s turn is the detail to watch. FBTC took in $236.7 million on Wednesday while IBIT bled, then gave back most of it a day later.
BTC Price Analysis: Bitcoin Loses Its 200-Day EMA
Bitcoin closed Thursday at $76,088, just under its 200-day EMA at $76,536. That average had held as support through the October pullback.
The 50-day EMA at $79,822 now sits above the price, and the $81,971 high from before last week’s Binance hack is the next resistance beyond it.
On the downside, the $74,968 swing low is the first support. Below it, the 50% Fibonacci retracement of the July-to-September rally sits at $72,598.

BTCUSDT 1D chart. Source: TradingView
| Outlook | Trigger | Level to watch |
|---|---|---|
| Rebound | A daily close back above $76,536, the 200-day EMA | $79,822, the 50-day EMA |
| Holding pattern | Holding between $74,968 and $76,536 | A tight range under the 200-day EMA |
| Sell-off | A daily close below $74,968 | $72,598, the 50% Fibonacci level |
One caveat: funding rates on Bitcoin perpetuals are still slightly positive on OKX, so longs haven’t fully cleared out even after a billion-dollar flush.
For anyone still asking “why is crypto down today?”, the answer runs through Nasdaq. If chip stocks steady when New York opens on Friday, Bitcoin has a shot at reclaiming its 200-day average. If they don’t, $74,968 is the line between a bad day and a deeper correction.
Disclaimer: Coinspeaker is committed to providing unbiased and transparent reporting. This article aims to deliver accurate and timely information but should not be taken as financial or investment advice. Since market conditions can change rapidly, we encourage you to verify information on your own and consult with a professional before making any decisions based on this content.

Daniel Frances is a technical writer and Web3 educator specializing in macroeconomics and DeFi mechanics. A crypto native since 2017, Daniel leverages his background in on-chain analytics to author evidence-based reports and deep-dive guides. He holds certifications from The Blockchain Council, and is dedicated to providing “information gain” that cuts through market hype to find real-world blockchain utility.













Post Comment