Gold’s Next Move: Will the Triangle Breakout Ignite a Market Surge?
After surging to record highs just last month, gold has taken a breather, settling into what looks like an ascending triangle on the 4-hour chart—it’s almost like this shiny metal is playing the waiting game. Are we on the cusp of a breakout, or is gold just teasing us with another round of consolidation? It’s a classic setup that has traders holding their breath, eyes glued to potential targets both above and below. With all the jittery moves stirred up by geopolitical chaos, AI-sector shocks, and the ever-shifting Fed vibe, this pause feels like gold’s moment to decide: rally harder or retreat? Curious about where it might head next and what numbers to watch? Dive in, and let’s unpack these possibilities—because when gold’s on the ropes, every tick counts. LEARN MORE.
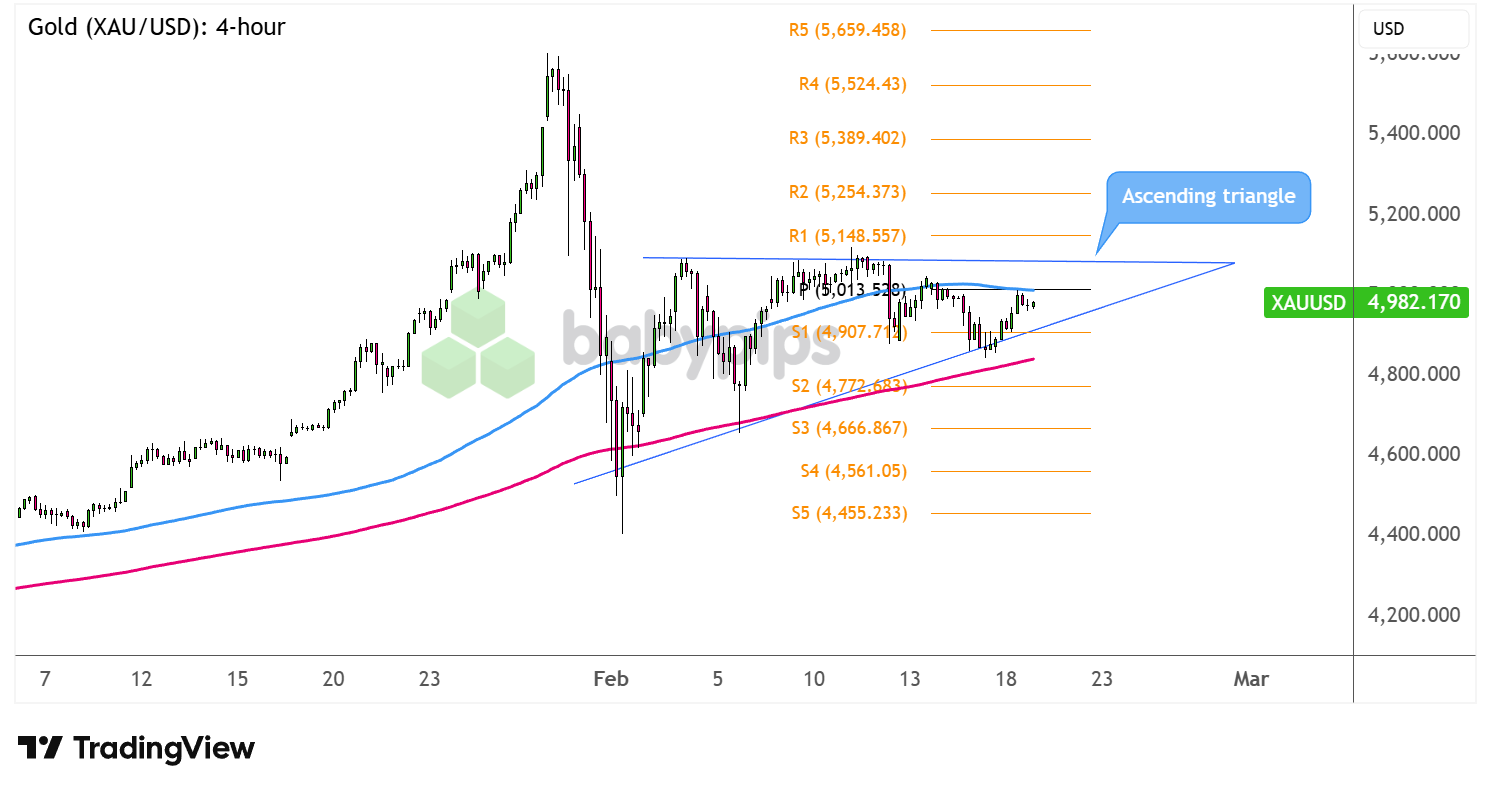
After spiking to record highs last month, gold is back in a holding pattern with this ascending triangle on the 4-hour time frame.
Could it be gearing up for a breakout soon?
Check out these potential targets in either direction!

Gold (XAUUSD) 4-hour Chart Faster with TradingView
This precious metal had its fair share of whipsawing price action early this month, reacting to a mix of factors including geopolitical headlines, AI-led tech sector disruption jitters, shifting Fed policy biases, and market panic, to name a few.
Now gold is back in consolidation as traders wait for the next big news. Which way can it go from here?
Remember that directional biases and volatility conditions in market price are typically driven by fundamentals. If you haven’t yet done your homework on the U.S. dollar and gold, then it’s time to check out the economic calendar and stay updated on daily fundamental news!
XAU/USD just bounced off the triangle support at S1 ($4,907.71) and appears to be setting its sights on resistance around the $5,100 major psychological level.
Stronger bullish momentum past that point could trigger a bullish break, potentially lifting gold to the next targets at R1 ($5,148.55), then R2 ($5,254.37). Keep an eye out for long green candles suggesting sustained upside pressure, which could take price up to R3 ($5,389.40) or onto test the record highs near R4 ($5,524.43).
On the other hand, a return in bearish momentum could lead to another test of support or perhaps a breakdown to the next downside targets at S2 ($4,772.68) then S3 ($4,666.86).
Just be sure to watch out for the release of top-tier U.S. data points, including the advance GDP report and core PCE price index that could strongly influence Fed expectations and overall sentiment.
Whichever bias you end up trading, don’t forget to practice proper risk management and stay aware of top-tier catalysts that could influence overall market sentiment.
Disclaimer:
Please be aware that the technical analysis content provided herein is for informational and educational purposes only. It should not be construed as trading advice or a suggestion of any specific directional bias. Technical analysis is just one aspect of a comprehensive trading strategy. The technical setups discussed are intended to highlight potential areas of interest that other traders may be observing. Ultimately, all trading decisions, risk management strategies, and their resulting outcomes are the sole responsibility of each individual trader. Please trade responsibly.
Promoted: Protecting your trading capital starts with securing your access. Don’t let a weak password be the single point of failure for your brokerage or exchange accounts. LastPass simplifies your digital life by generating and storing complex, encrypted passwords for every site you use. Secure Your Accounts with LastPass Today!
Disclosure: We may earn a commission from our partners if you sign up through our links, at no extra cost to you.