Is the U.S. Dollar Index on the Verge of a Major Breakout at This Crucial Support Level?
Is the U.S. dollar gearing up for a breakout after finding solid footing at a key technical support zone? It’s fascinating to watch the Greenback dance right around the 99.50 level, which isn’t just any random number—it lines up with that golden 61.8% Fibonacci retracement, the 100 SMA on the 4-hour chart, and an ascending channel that’s been holding since mid-September. Now, if those green candlesticks keep showing up and the index stays above 99.50, we might just witness a run toward fresh Q4 highs. But hey, one false move below the S1 Pivot Point at 99.18 could pull it downward. It’s like watching a high-stakes chess game play out in real-time—with every tick possibly signaling the next big move. Curious to see if the dollar’s about to flex its muscles for a sustained upswing? Let’s dive deeper. LEARN MORE.
The U.S. dollar is turning higher from a key technical support zone!
Think the Greenback is due for a days-long upswing?
Here’s what we’re seeing on the 4-hour time frame:

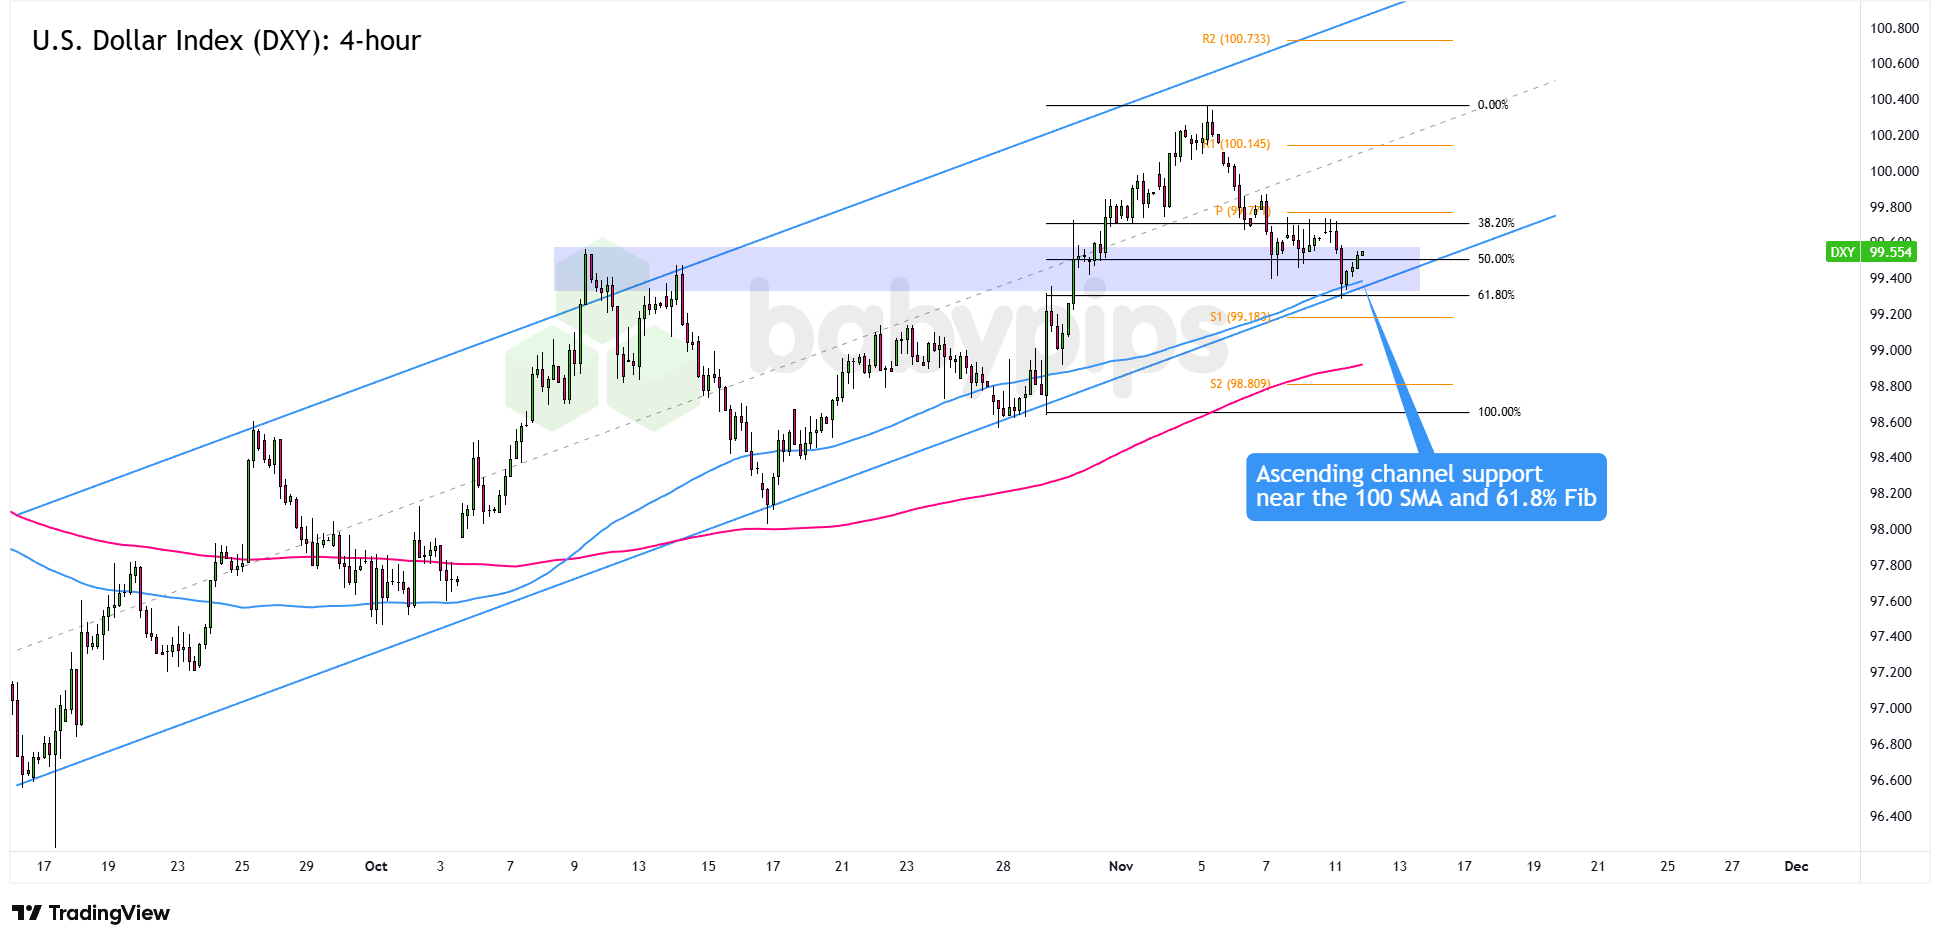
U.S. Dollar Index (DXY) 4-hour Forex Chart by TV
Weak U.S. jobs data and growing expectations of a December Fed rate cut overshadowed easing government shutdown concerns earlier this week, pulling the U.S. dollar lower against most of its peers.
That could change in the coming days as more top-tier data roll in from other major economies and as the U.S. releases its backlog of economic reports following the government’s reopening.
Remember that directional biases and volatility conditions in market price are typically driven by fundamentals. If you haven’t yet done your fundie homework on the U.S. dollar, then it’s time to check out the economic calendar and stay updated on daily fundamental news!
The U.S. Dollar Index (DXY), which has been sliding since the start of the month, found some footing just below the 99.50 psychological level.
That area seems to have attracted buying interest, as it lines up with the 61.8% Fibonacci retracement of the late October upswing, the 100 SMA on the 4-hour chart, and the ascending channel support that has held since mid-September.
If DXY keeps printing green candlesticks and holds above 99.50, the index could make a run toward the 100.30 previous highs, or even push for new Q4 2025 highs.
If bearish candlesticks start showing up again, or if DXY stays below the S1 Pivot Point at 99.18, we could see a move down toward the S2 support area.
If you’re not familiar with the DXY, check out our lesson, What is the US Dollar Index?
Disclaimer:
Please be aware that the technical analysis content provided herein is for informational and educational purposes only. It should not be construed as trading advice or a suggestion of any specific directional bias. Technical analysis is just one aspect of a comprehensive trading strategy. The technical setups discussed are intended to highlight potential areas of interest that other traders may be observing. Ultimately, all trading decisions, risk management strategies, and their resulting outcomes are the sole responsibility of each individual trader. Please trade responsibly.