XRP’s Sudden Volume Drop Sparks Secrets Behind Institutional Ambitions—What’s Really Driving the Shift?
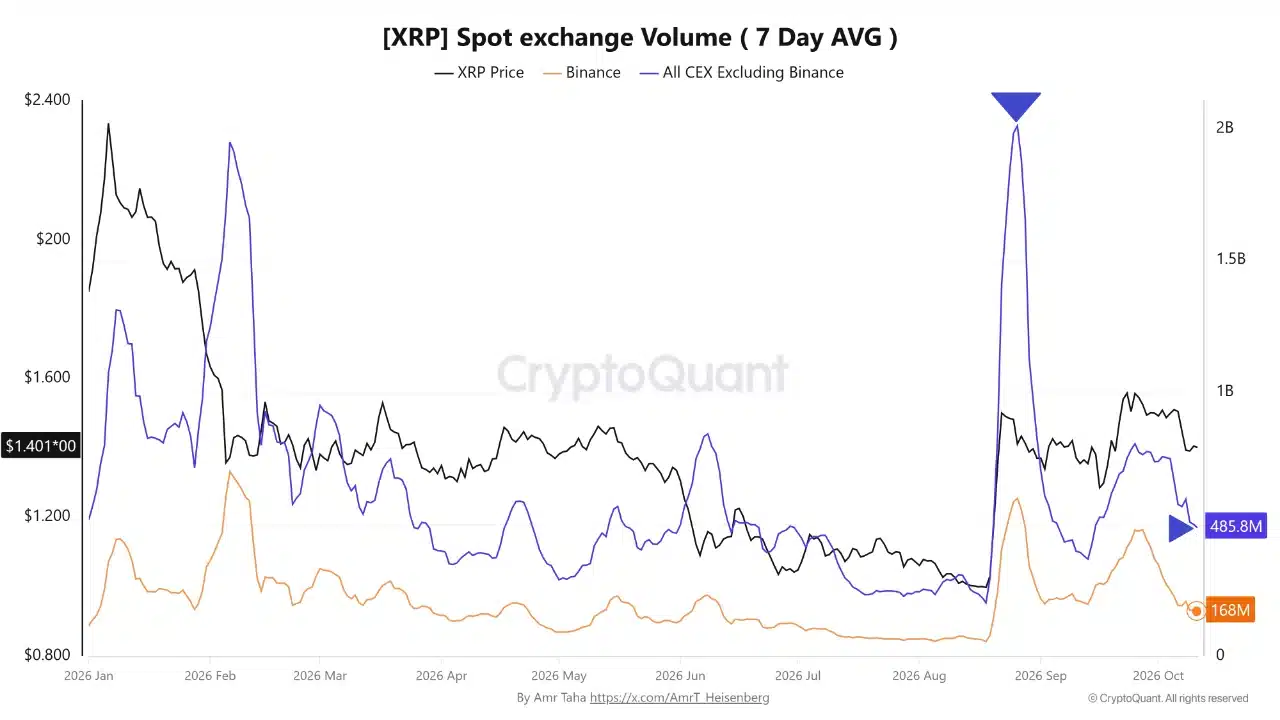
XRP is holding steady near $1.38, barely budging in the last day but down nearly 10% over the past week after dipping to around $1.31—a classic crypto seesaw that’s got traders scratching their heads. The odd part? While the price bounced back, spot buyers seem to have gone AWOL. Centralized exchange spot volume dropped by a whopping $1.943 billion between late August and early October, even as futures trading swelled to nearly double what spot volume saw. It kinda begs the question: are investors getting cold feet on actual ownership, preferring to play the derivatives game instead? On Binance, spot volume plunged from $597 million to $168 million, flipping the usual spot-to-futures ratio on its head. Institutional XRP ETFs did see net inflows last week, but will that be enough to balance out the slack in spot activity? The next hurdles: can XRP break resistance around $1.44, or is another dip looming? All eyes on whether spot demand will rally or stay sidelined—and honestly, this tug-of-war between price and participation might just be crypto’s latest drama. LEARN MORE.
XRP is trading near $1.38, flat in the last 24 hours and down 9.9% over seven days, after bouncing from a low of about $1.31. Our XRP price forecast starts with a gap between price and participation.
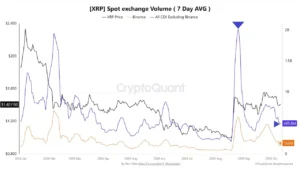
The recovery has not brought spot buyers back: CryptoQuant’s figures show centralized-exchange spot volume falling by $1.943 billion between August 26 and October 11. A price can stabilize while demand shifts toward derivatives, and the numbers fit that pattern. Perpetual futures open interest stands at $4.56 billion, about twice the $2.18 billion traded in the last 24 hours.
On Binance, the seven-day average spot volume fell from $597 million to $168 million, and the spot-to-futures volume ratio slid to 12.7% on October 11. Futures volume was then about 7.9 times spot volume. CryptoQuant said traders may be waiting for lower entry prices, though the ratio alone does not show whether leveraged positioning is bullish or bearish.

Spot Exchange Volume CryptoQuant
The October 13 backdrop was risk-off, with total crypto market capitalization reported down 2.88% to $2.81 trillion. Institutional access remains part of the XRP story: U.S.-listed spot XRP exchange-traded funds (ETFs) logged $11.31 million in weekly net inflows for the week ending October 9.
Can those inflows offset weak spot turnover? Price levels offer the next test.
Sign Up With MergeX And Trade Crypto
XRP Price Forecast: Can XRP Price Reclaim $1.44 This Week?

XRPUSDT Price Chart 1D TradingView
Since the late-August jump, XRP has mostly traded between roughly $1.27 and $1.47 on the daily chart, apart from brief spikes toward $1.70 and $1.65. Binance’s 25-day exponential moving average (EMA) sits at $1.372, right at the current price, and the 99-day EMA at $1.396 is still overhead. That points to consolidation beneath nearby resistance, not a confirmed breakout.
- Bull case: The $1.30–$1.38 area holds and spot participation improves. A move through $1.44 and the $1.4711 level, about 7% above spot, could then put the $1.50 region and the $1.6238 level in view.
- Base case: Price stays beneath the 99-day EMA and trades in a range, with derivatives-led activity making conviction harder to read.
- Bear case: A break below $1.30 would weaken the structure and expose the $1.2659 level, about 8% below spot, with $1.20 below that.
The recent volume picture adds a caveat: a similar relative decline in spot participation appeared in mid-August, before a sharp rebound, but one precedent is not a signal. For a closer look at order-book activity, see this XRP order-book analysis. Any near-term forecast depends on both price holding support and spot demand returning.
Market Intelligence: Crypto Analyst Predicts Best Low-Cap Crypto
Looking Beyond XRP? LiquidChain Wants Bitcoin, Ethereum and Solana in One Place
For XRP holders, the immediate setup depends on whether the current range holds, and a break in either direction can move quickly. For traders who want exposure beyond a single chain, LiquidChain ($LIQUID) takes a different approach.
LiquidChain is a Layer 3 infrastructure project that aims to bring Bitcoin, Ethereum, and Solana liquidity together in one execution environment. Its Deploy-Once Architecture lets developers launch an app once and reach users across all three ecosystems. It is backed by a Unified Liquidity Layer, Single-Step Execution, and Verifiable Settlement.
The token is priced at $0.014965 in presale, and the project has raised more than $984,000 of its current $1.09 million stage target. Staking is already live, with an advertised APY of 1,167%. The presale page lists audits from SpyWolf and CertiK.
For readers comparing infrastructure narratives, Ripple’s institutional custody push is another part of the wider market context.
Early-stage infrastructure plays carry obvious risk. Those comfortable with that risk profile can research LiquidChain directly.
Layer 3 Is Already Here, Smart Money Knows It – Do You?
DISCOVER: Best Meme Coins to Buy in 2026
Disclaimer: Coinspeaker is committed to providing unbiased and transparent reporting. This article aims to deliver accurate and timely information but should not be taken as financial or investment advice. Since market conditions can change rapidly, we encourage you to verify information on your own and consult with a professional before making any decisions based on this content.

Daniel Frances is a technical writer and Web3 educator specializing in macroeconomics and DeFi mechanics. A crypto native since 2017, Daniel leverages his background in on-chain analytics to author evidence-based reports and deep-dive guides. He holds certifications from The Blockchain Council, and is dedicated to providing “information gain” that cuts through market hype to find real-world blockchain utility.









Post Comment