EUR/USD Teeters on Edge: Will ECB and Fed Moves Trigger a Market Shock?
Here we go again — central banks are gearing up for their big moments, with the ECB poised to break its quiet streak with a rate hike on June 11, followed closely by the Fed’s June 16-17 rendezvous amid its ongoing tug-of-war between sticky inflation and slowing growth. It’s like watching a slow dance where the EUR/USD pair hovers near a six-week low, caught in this awkward middle ground: a shrinking rate gap pulling the euro up just as an unfazed dollar refuses to bow out. So, what’s the real story here? Is the euro finally flexing its muscles, or is the dollar holding onto its crown a bit longer? The coming days promise drama, with key technical levels and fundamental shifts setting the stage for a possible market twist. Ready to dive deeper into what’s shaping the forex battleground? LEARN MORE.
Two major central bank decisions are coming up fast: the ECB on June 11 and the Fed on June 16 to 17.
The ECB is widely expected to hike for the first time since 2023, while the Fed is still stuck between stubborn inflation and softer growth.
EUR/USD is sitting near a six-week low, caught between a narrowing rate gap and a dollar that still has not rolled over.
Multi-Timeframe Technical Breakdown
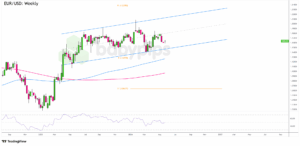
EUR/USD: Weekly
EUR/USD Weekly Forex Chart Faster with TradingView
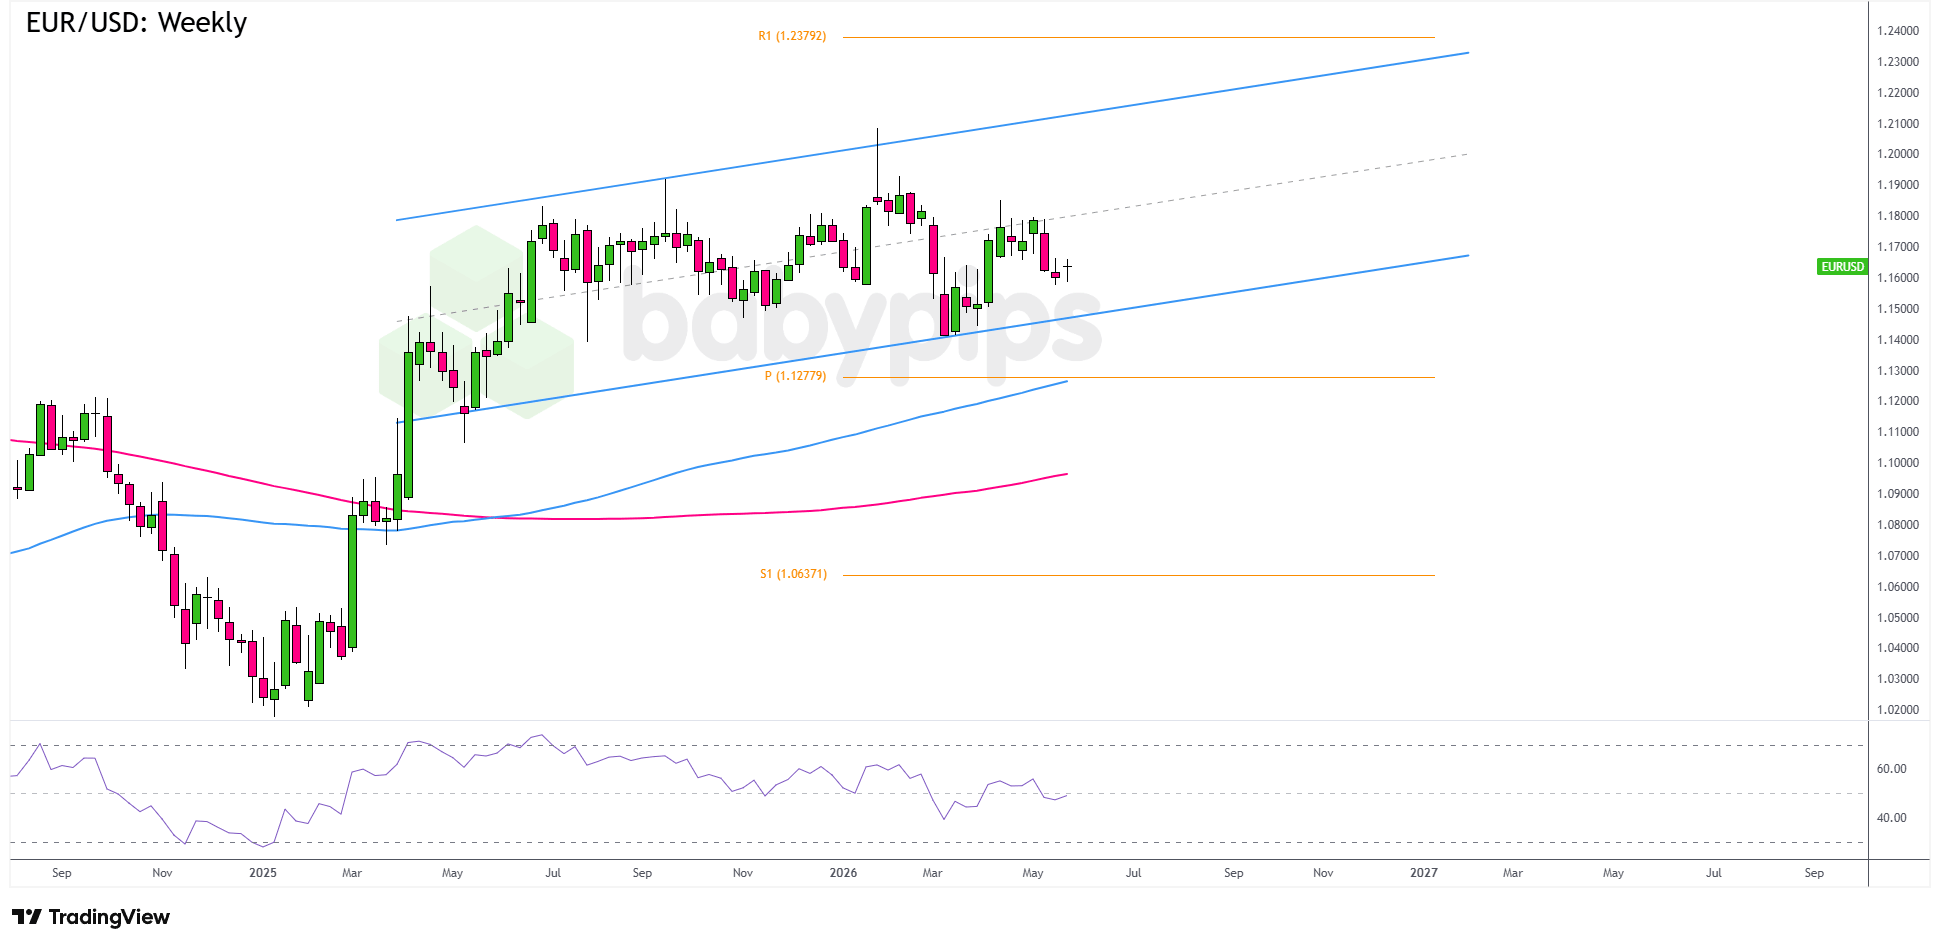
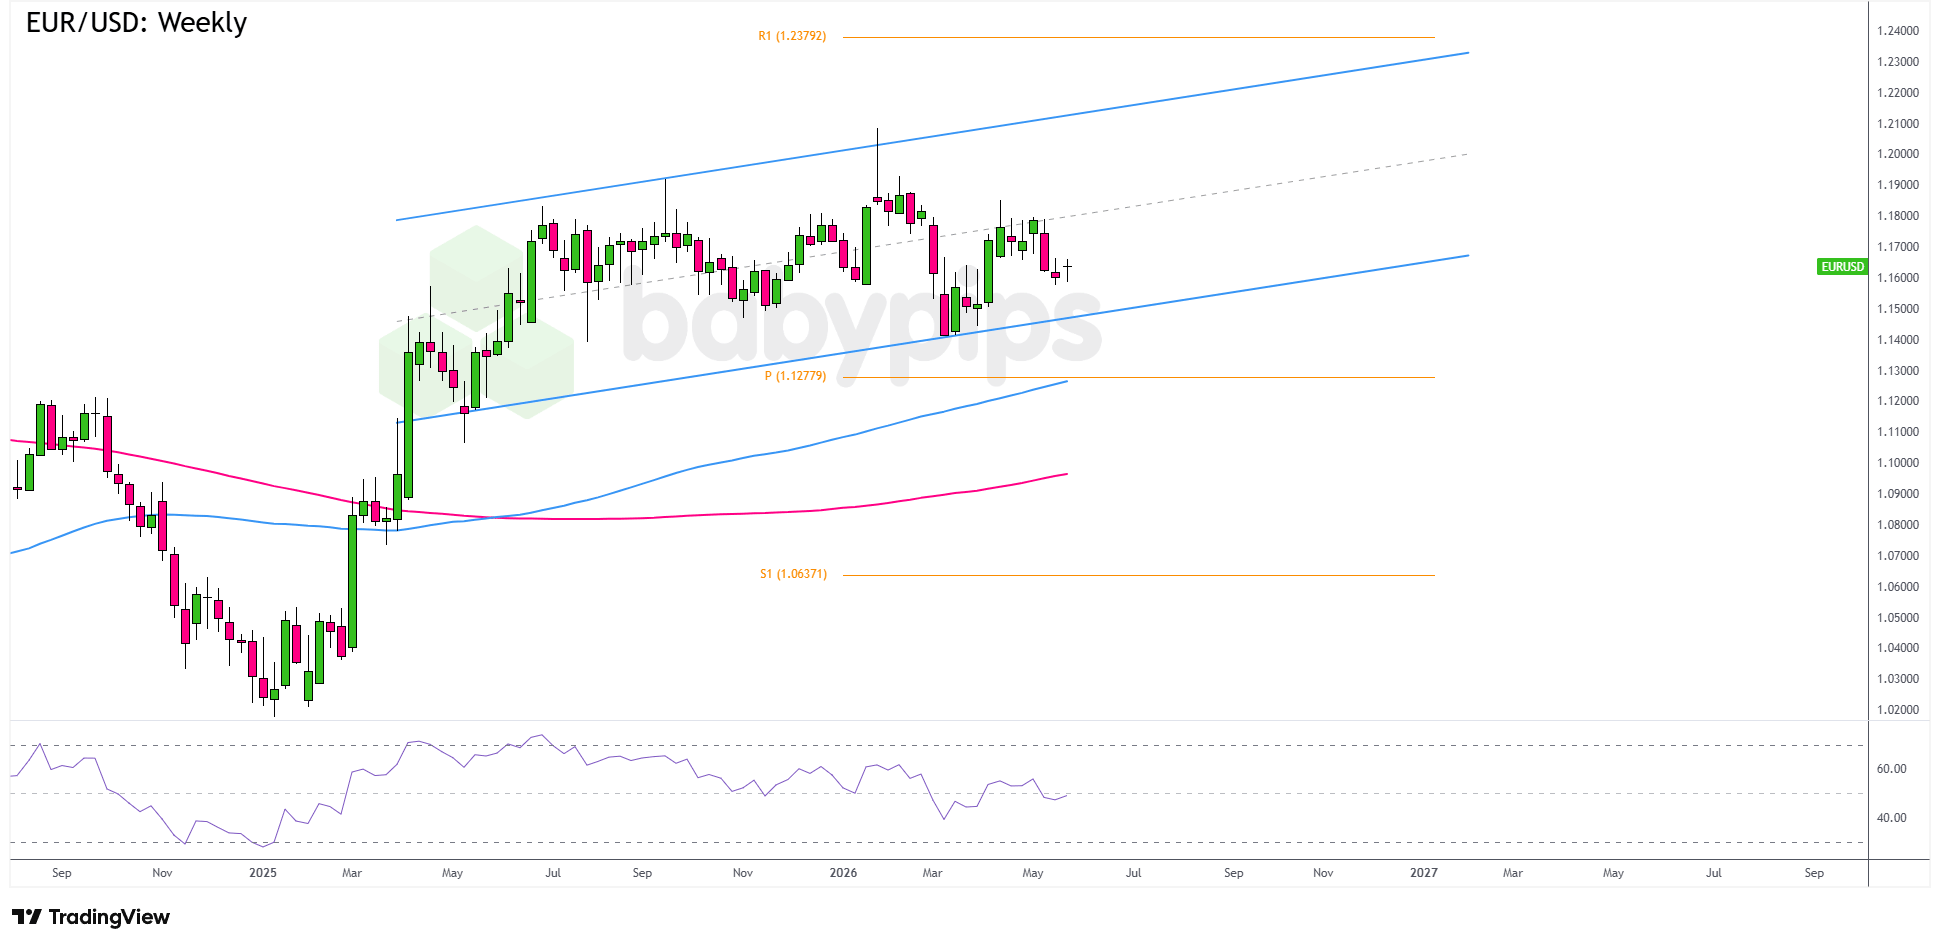
Long term, the euro still has the edge. EUR/USD surged from its 2025 low near 1.0200 to a January 2026 peak above 1.2000, then pulled back inside an ascending channel.
Price is now testing the lower end of that channel near 1.1650, with the key support zone around 1.1550 – 1.1600. The 100 SMA sits above price near 1.1720, adding resistance, while the 200 SMA remains far below around 1.0900 – 1.1000, keeping the broader bullish structure intact.
Weekly RSI is near 45, below neutral but not oversold, so the pullback is still active but not exhausted. The most important level on this timeframe is the channel’s lower boundary, near 1.1550–1.1600.
EUR/USD: Daily
EUR/USD Daily Forex Chart Faster with TradingView
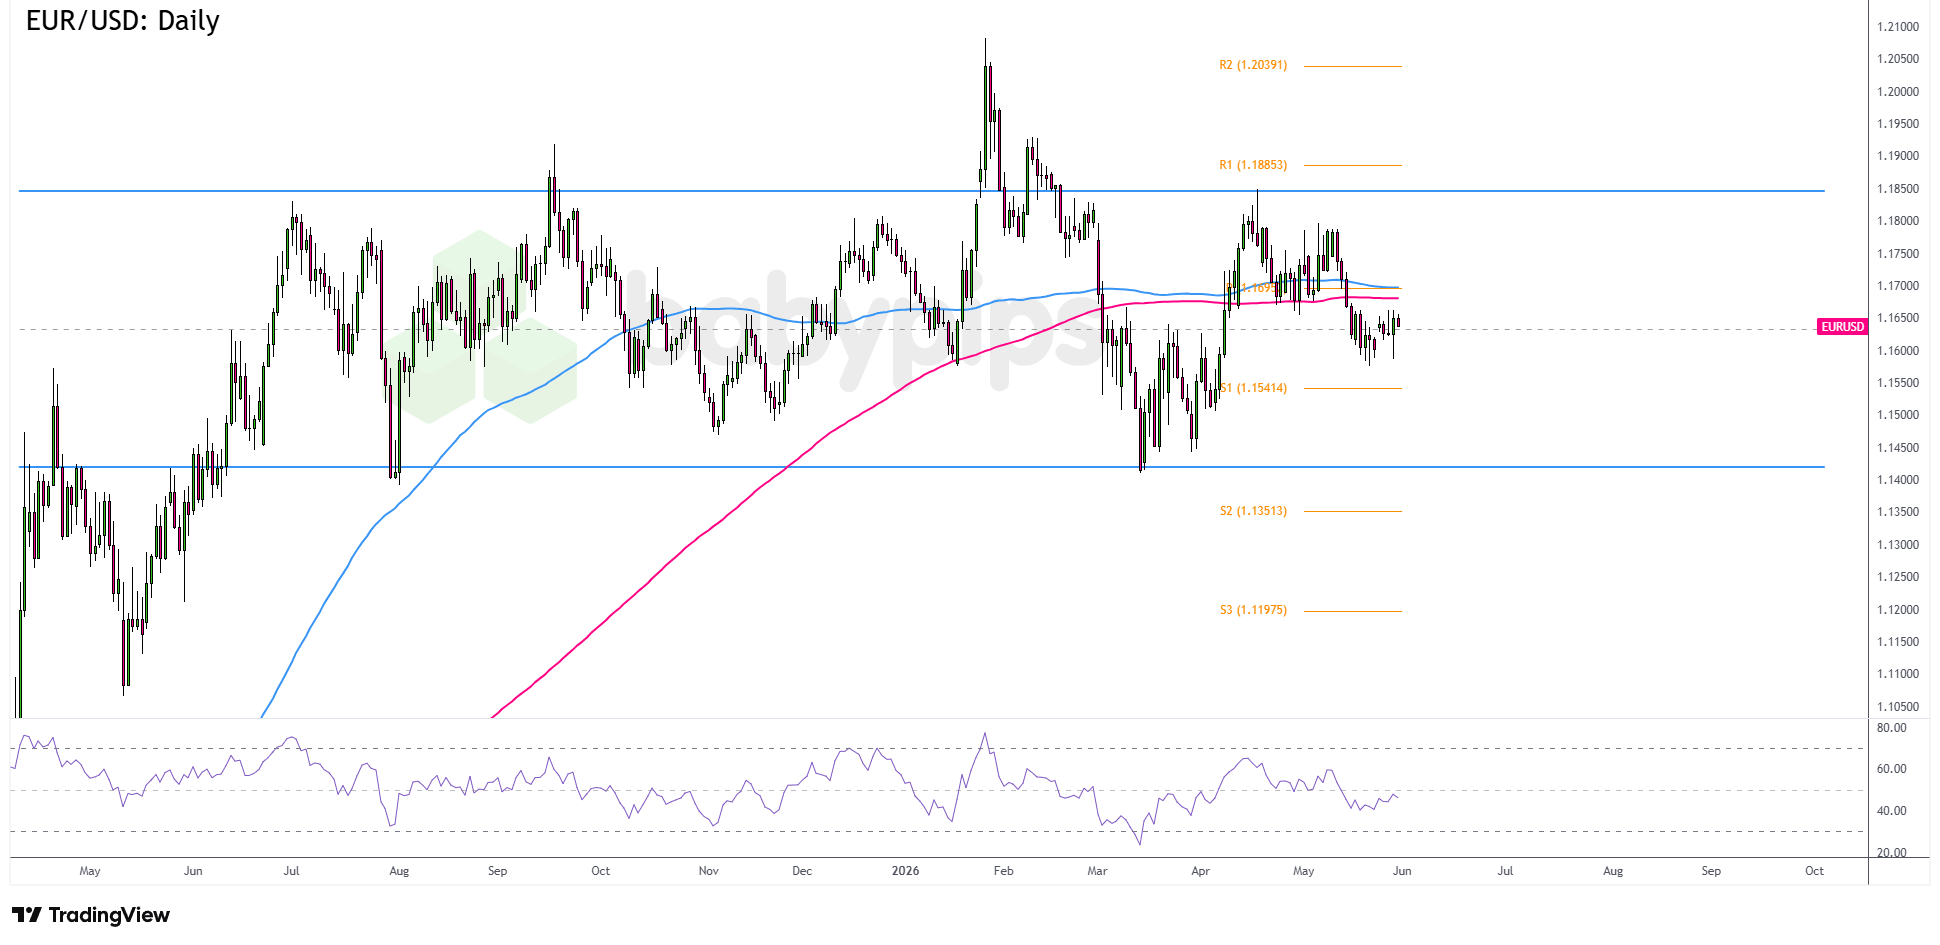
On the daily chart, EUR/USD has broken below both moving averages, putting the medium-term trend under pressure. The 100 SMA near 1.1700 and the 200 SMA near 1.1670 now act as resistance above price. The pair has been sliding since the late April highs near 1.1800, and the break below both SMAs keeps sellers in control for now.
Daily RSI is near 40, showing bearish momentum but not oversold conditions yet. The key level below is daily S1 at 1.1540. A sustained close under that area could signal a deeper leg lower.
EUR/USD: 4-hour
EUR/USD 4-hour Forex Chart Faster with TradingView
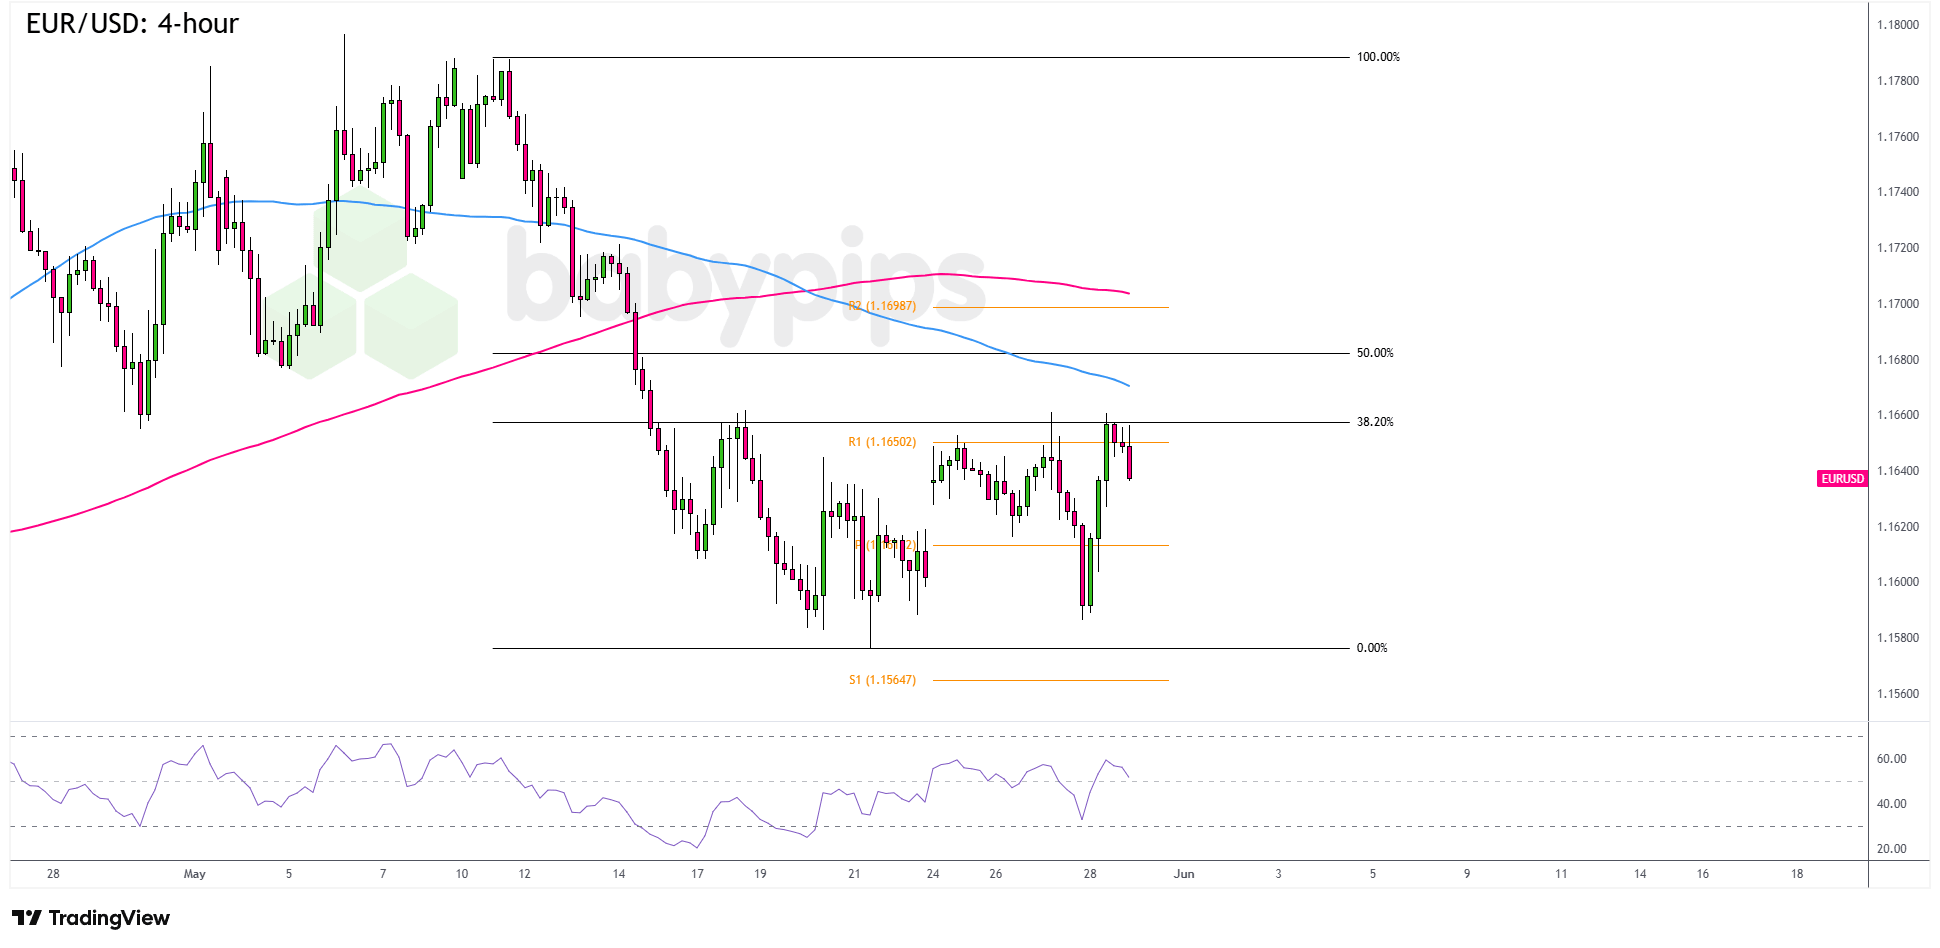
The 4-hour chart gives the clearest read on the current setup. EUR/USD dropped from the mid-May high near 1.1800 to around 1.1580, then started recovering. Price is now near 1.1640, right around the 38.2% Fibonacci retracement. Both moving averages are still above price, with the 100 SMA near 1.1660 and the 200 SMA near 1.1700. Until EUR/USD clears those levels, the short-term setup stays cautious.
RSI is near 52, back from oversold and close to neutral. The immediate level to watch is pivot R1 at 1.1650. A break above that could open the door to the 50% Fib near 1.1690.
Key Levels at a Glance
| Level | Type | Why it matters |
|---|---|---|
| 1.1700 | Resistance | Confluence of the 200 SMA on the 4-hour and the 50% Fibonacci retracement; a key ceiling for any near-term recovery attempt |
| 1.1650 / R1 | Decision zone | The pivot R1 level at 1.165 aligns with the 38.2% Fibonacci level; current price is testing this zone right now |
| 1.1580 | Support | The base of the recent swing low on the 4-hour; losing this level would suggest the decline is continuing |
| 1.1541 / Daily S1 | Major support | Daily pivot support S1; a sustained break below this would open the move toward 1.135 area |
| 1.1800 | Resistance | The May swing high and the 100% Fibonacci reference on the 4-hour; would likely only be tested on a confirmed ECB rate hike catalyst |
Promoted: When EUR/USD is sitting near a six-week low ahead of back-to-back ECB and Fed decisions, traders need more than a quick read on rate expectations.Maven Trading provides simulated funding challenges starting as low as $15, allowing you to trade major pairs with professional-sized capital. No time limits mean you can wait for cleaner setups around eurozone CPI, U.S. jobs data, central bank signals, and key EUR/USD levels without the pressure of a ticking clock.
Learn More About Maven Trading Today!
Disclosure: We may earn a commission from our partners if you sign up through our links, at no extra cost to you.
Fundamental Backdrop
The Federal Reserve currently holds its benchmark rate in a 3.50% to 3.75% range after holding for a third straight meeting on April 29. The vote was unusually divided at 8-4, with some officials favoring a cut while others wanted to remove easing language altogether. The next FOMC meeting is June 16-17 and includes a fresh dot plot.
Markets are currently pricing roughly no rate cuts for 2026, though that could shift after the June 6 non-farm payrolls report. For now, the Fed’s stance is cautious and data dependent.
The European Central Bank holds its deposit rate at 2.00%, unchanged since its last cut in June 2025. But the ECB’s April minutes showed the hold was a close call, with some members saying they would have voted to hike if a hike had been proposed.
ECB board member Isabel Schnabel said on May 28 that a June rate hike is necessary, warning that Euro Area inflation, currently at 3.0%, could move toward 4% as energy costs keep rising. Markets now see around an 80% chance of a 25 basis point hike on June 11, which would take the deposit rate to 2.25%.
The rate gap still favors the dollar, with the Fed at 3.50% to 3.75% versus the ECB at 2.00%. But that gap is now narrowing, and that is the main structural story supporting the euro over the medium term.
Macro Context
Three macro themes matter most for EUR/USD in the foreseeable future:
First, the US economy is starting to look stagflationary, with slow growth and sticky inflation. Q1 GDP was revised down to 1.6%, below the 2.0% forecast, while April consumer spending rose just 0.1% and personal income slipped 0.1%.
Second, inflation is still not playing nice. Core PCE, the Fed’s preferred inflation gauge, held at 3.3% year over year in April. That leaves the Fed with little room to cut, even as growth cools.
Third, the US-Iran situation around the Strait of Hormuz remains a wild card for the dollar. Escalation could trigger safe haven demand and pressure EUR/USD, while a confirmed peace deal could knock the dollar lower within hours.
What to Watch This Week
Euro Area Preliminary May CPI (June 3): The flash inflation reading for the Eurozone. If it remains near or above the April 3.0% reading, it would almost certainly confirm June 11 ECB hike expectations and likely support the euro. A significant cool-down could reduce ECB urgency and weigh on EUR/USD.
US ISM Manufacturing PMI (June 2): A reading of US factory health. A print below 50 (contraction territory) would deepen stagflation concerns and probably limit dollar upside. A strong beat would reinforce the case for a hawkish Federal Reserve hold at the June 16–17 meeting.
US ADP Employment (June 4): Private sector job creation data, watched as an early preview of the official jobs report. A soft reading would likely reduce demand for the dollar heading into Friday’s NFP.
US Non-Farm Payrolls (June 6): The week’s most important catalyst for EUR/USD. A soft payrolls print would probably push the pair higher heading into the ECB meeting week. A strong print would likely support the dollar and could keep EUR/USD capped below 1.170.
The Scenarios
These are not predictions or trade recommendations. They are probability frameworks — possible outcomes based on current conditions, not guarantees of what will happen.
Scenario A — Euro Recovery Builds | Medium probability
If Eurozone May CPI on June 3 prints near or above April’s 3.0%, ECB rate hike expectations for June 11 would likely firm further. If US NFP on June 6 then surprises to the downside — consistent with the weak April consumer spending data — the dollar could soften.
In that combination, EUR/USD would probably push back above the 200 SMA on the 4-hour (~1.170) and could approach the 1.175–1.180 area ahead of the June 11 ECB decision. The first condition for this scenario: the 38.2% Fibonacci level near 1.164 holding as support into next week.
Scenario B — Dollar Resilience Keeps the Pair Capped | Medium probability
If the US NFP on June 6 surprises to the upside, the dollar would likely find renewed support. If Eurozone May CPI cools significantly on June 3 — reducing ECB rate hike urgency — then the euro’s fundamental tailwind weakens at the same time.
In this environment, EUR/USD would probably remain below both SMAs on the 4-hour chart, with risk of a retest of the daily S1 at 1.154. A confirmed Iran peace deal could also briefly reduce safe-haven demand for the dollar while simultaneously reducing Eurozone energy inflation, creating a mixed rather than directional signal.
Both scenarios carry similar convictions and are labeled Medium probability. The data flow this week is evenly balanced between EUR-positive and USD-positive catalysts.
Summary Table
| Timeframe | Trend | Bias | Primary Bias |
|---|---|---|---|
| Weekly | Long-term bullish; near-term pullback within ascending channel | Below 100 SMA; above 200 SMA; channel support holds | Neutral |
| Daily | Medium-term pullback in progress from January 2026 high | Below both 100 SMA (~1.170) and 200 SMA (~1.167); RSI ~40 | Bearish |
| 4-Hour | Short-term recovery bounce from 1.158 swing low | Below both SMAs; at 38.2% Fibonacci; RSI ~52 recovering | Neutral |
This EUR/USD analysis works through three separate chart timeframes to build one directional view, and the logic behind that approach can be easy to miss if you haven’t come across it before. Premium members can read our lesson:
📖 The Top-Down Approach: Start Big, Then Zoom In
Reading this helps you understand the top-down analytical framework, how each timeframe serves a different role in the analysis, and how to move from the weekly trend context all the way down to a 4-hour entry decision.




![Unlock Your Rivals' Secrets: The Ultimate SEO Competitor Analysis Guide [+ Free Template]](https://onlinecashshop.com/wp-content/uploads/2026/05/unlock-your-rivals-secrets-the-ultimate-seo-competitor-analysis-guide-free-template-300x126.jpg)





Post Comment