Ethereum at a Crossroads: Will ETH Ignite a New Surge or Face a Sharp Decline?

Ever get that feeling when Ethereum’s price action is like a cat stuck contemplating whether to jump off the couch or leap onto the table? That’s exactly where ETH is hanging right now — stuck in a corrective phase that’s thankfully less of a nosedive and more of a slow simmer. It’s holding firm above key demand levels, with volatility tightening like a coiled spring. But here’s the million-dollar question: will it break lower or gather enough steam for a bigger bounce? Momentum’s playing a mixed tune, and ETH is trailing behind Bitcoin, yet the bears seem to be losing their grip. This limbo between consolidation and potential breakout is what every trader and investor is eyeballing closely — because a little move either way could set the stage for what comes next. Curious to see how this unfolds in the daily and 4-hour charts, and what the on-chain whispers tell us about ETH’s real intentions? LEARN MORE.
Ethereum is still stuck in a broader corrective phase, but the structure is no longer aggressively bearish. The asset is holding above key higher-timeframe demand while volatility has compressed. This is typically where the market decides between a continuation lower or a larger corrective push higher. Momentum remains mixed, and ETH is still lagging relative to BTC, but downside follow-through has clearly weakened.
Ethereum Price Analysis: The Daily Chart
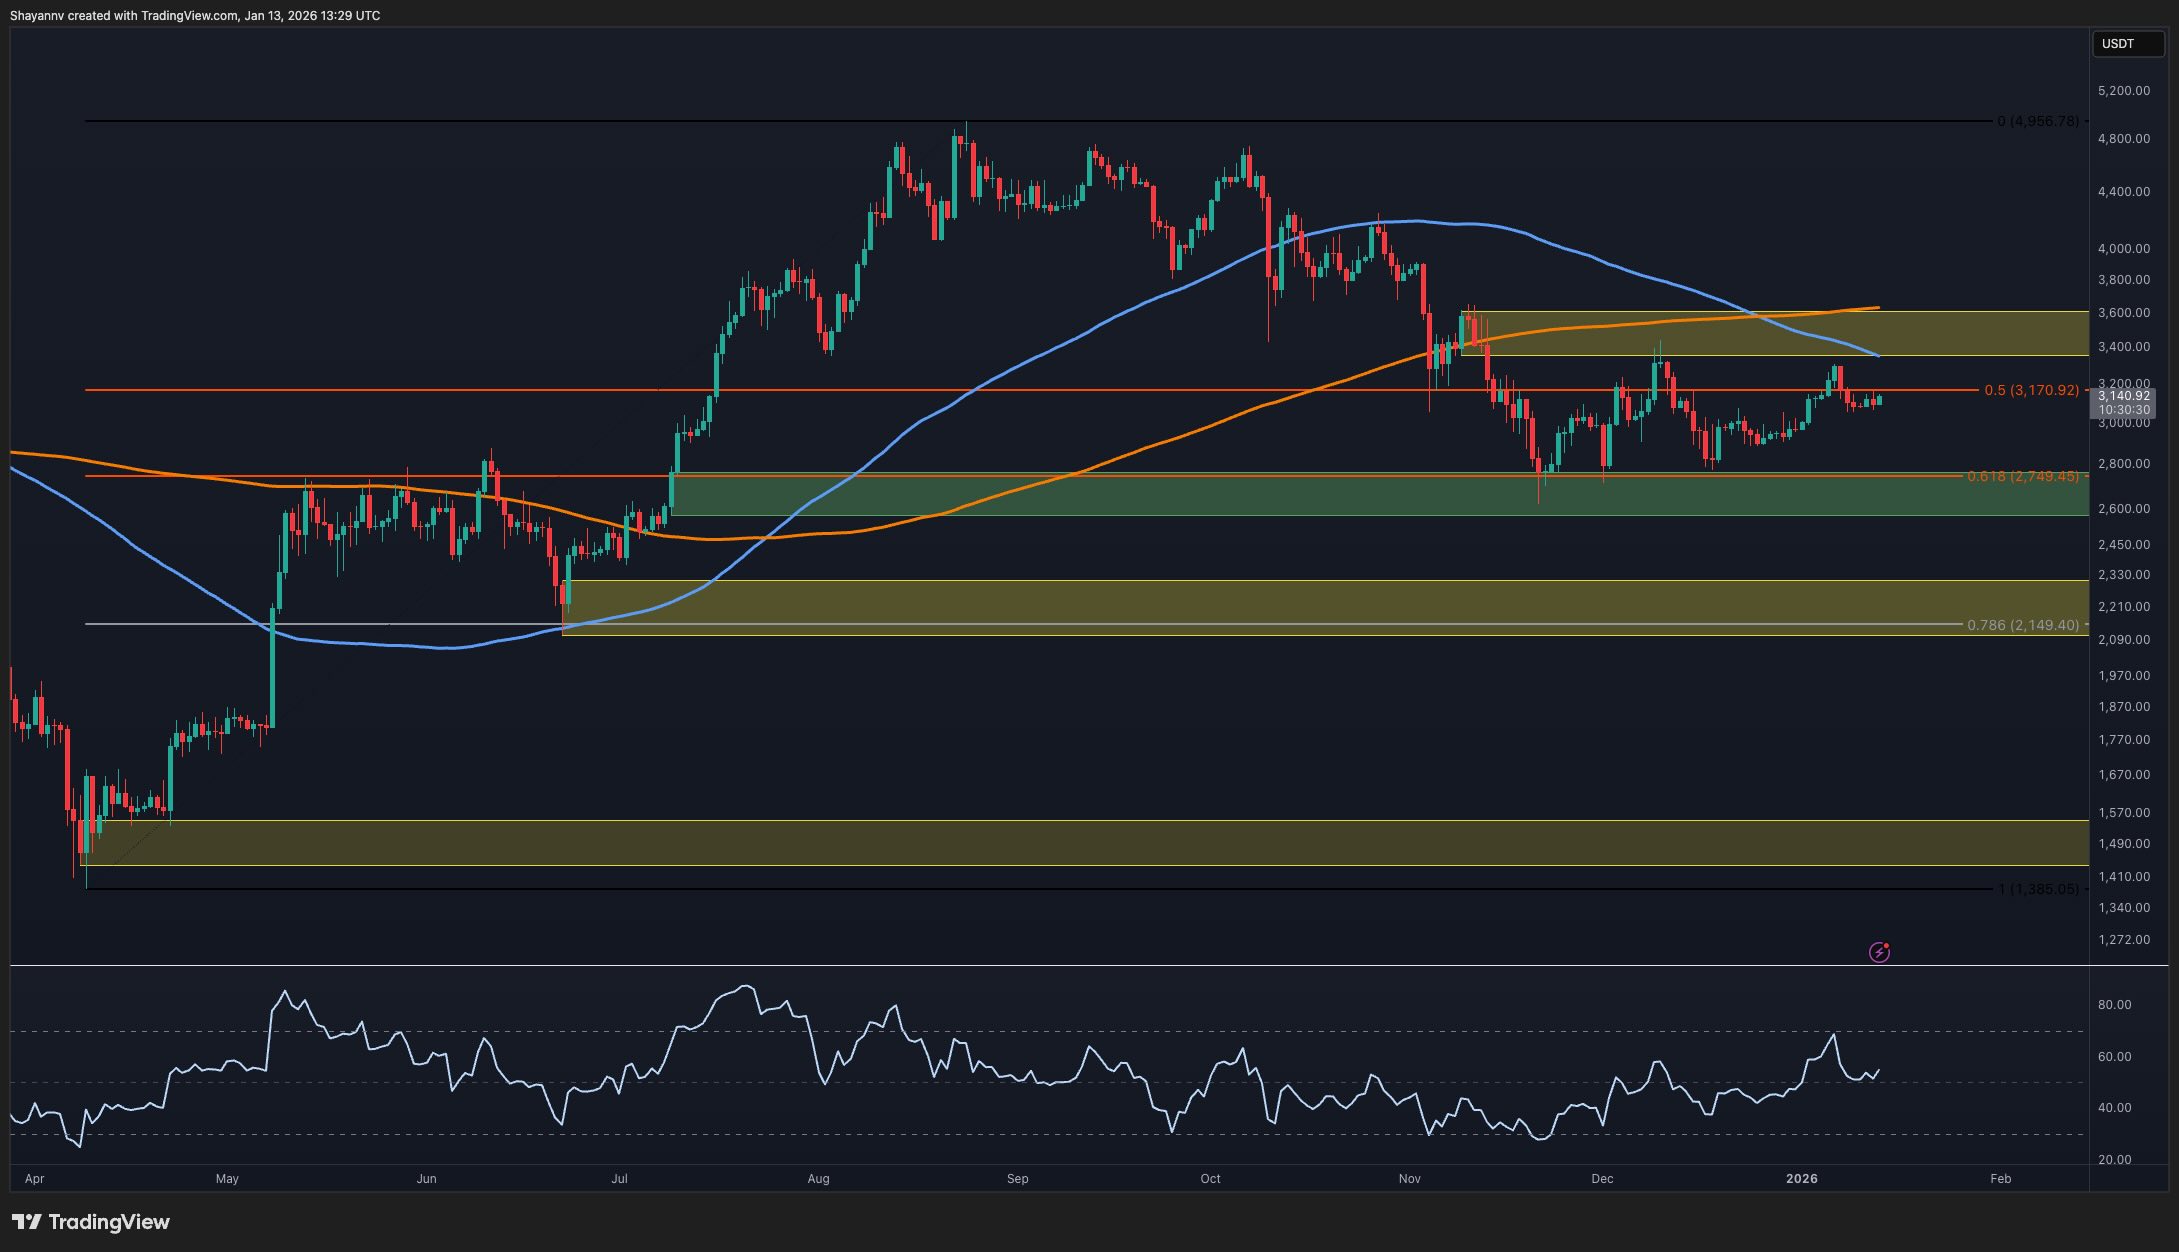
On the daily timeframe, ETH remains below the major 100-day and 200-day moving averages and is capped by a significant supply zone around the $3.5k region. This zone has repeatedly rejected the price and aligns with the prior distribution.
That said, the selloff into the lower $2.6k–$2.7k area was aggressively defended. The asset respected that demand zone cleanly and has since transitioned into a range-bound structure in the Fibonacci golden zone. Yet, as the key moving averages are still overhead and acting as dynamic resistance, the daily bias remains neutral to slightly bearish until they are reclaimed.
As long as ETH holds above the $2.6k-$2.7k demand area, current price action looks more like consolidation after distribution, not panic selling. A daily close back above the $3.5k zone and the 200-day MA would be the first real signal of strength.
ETH/USDT 4-Hour Chart
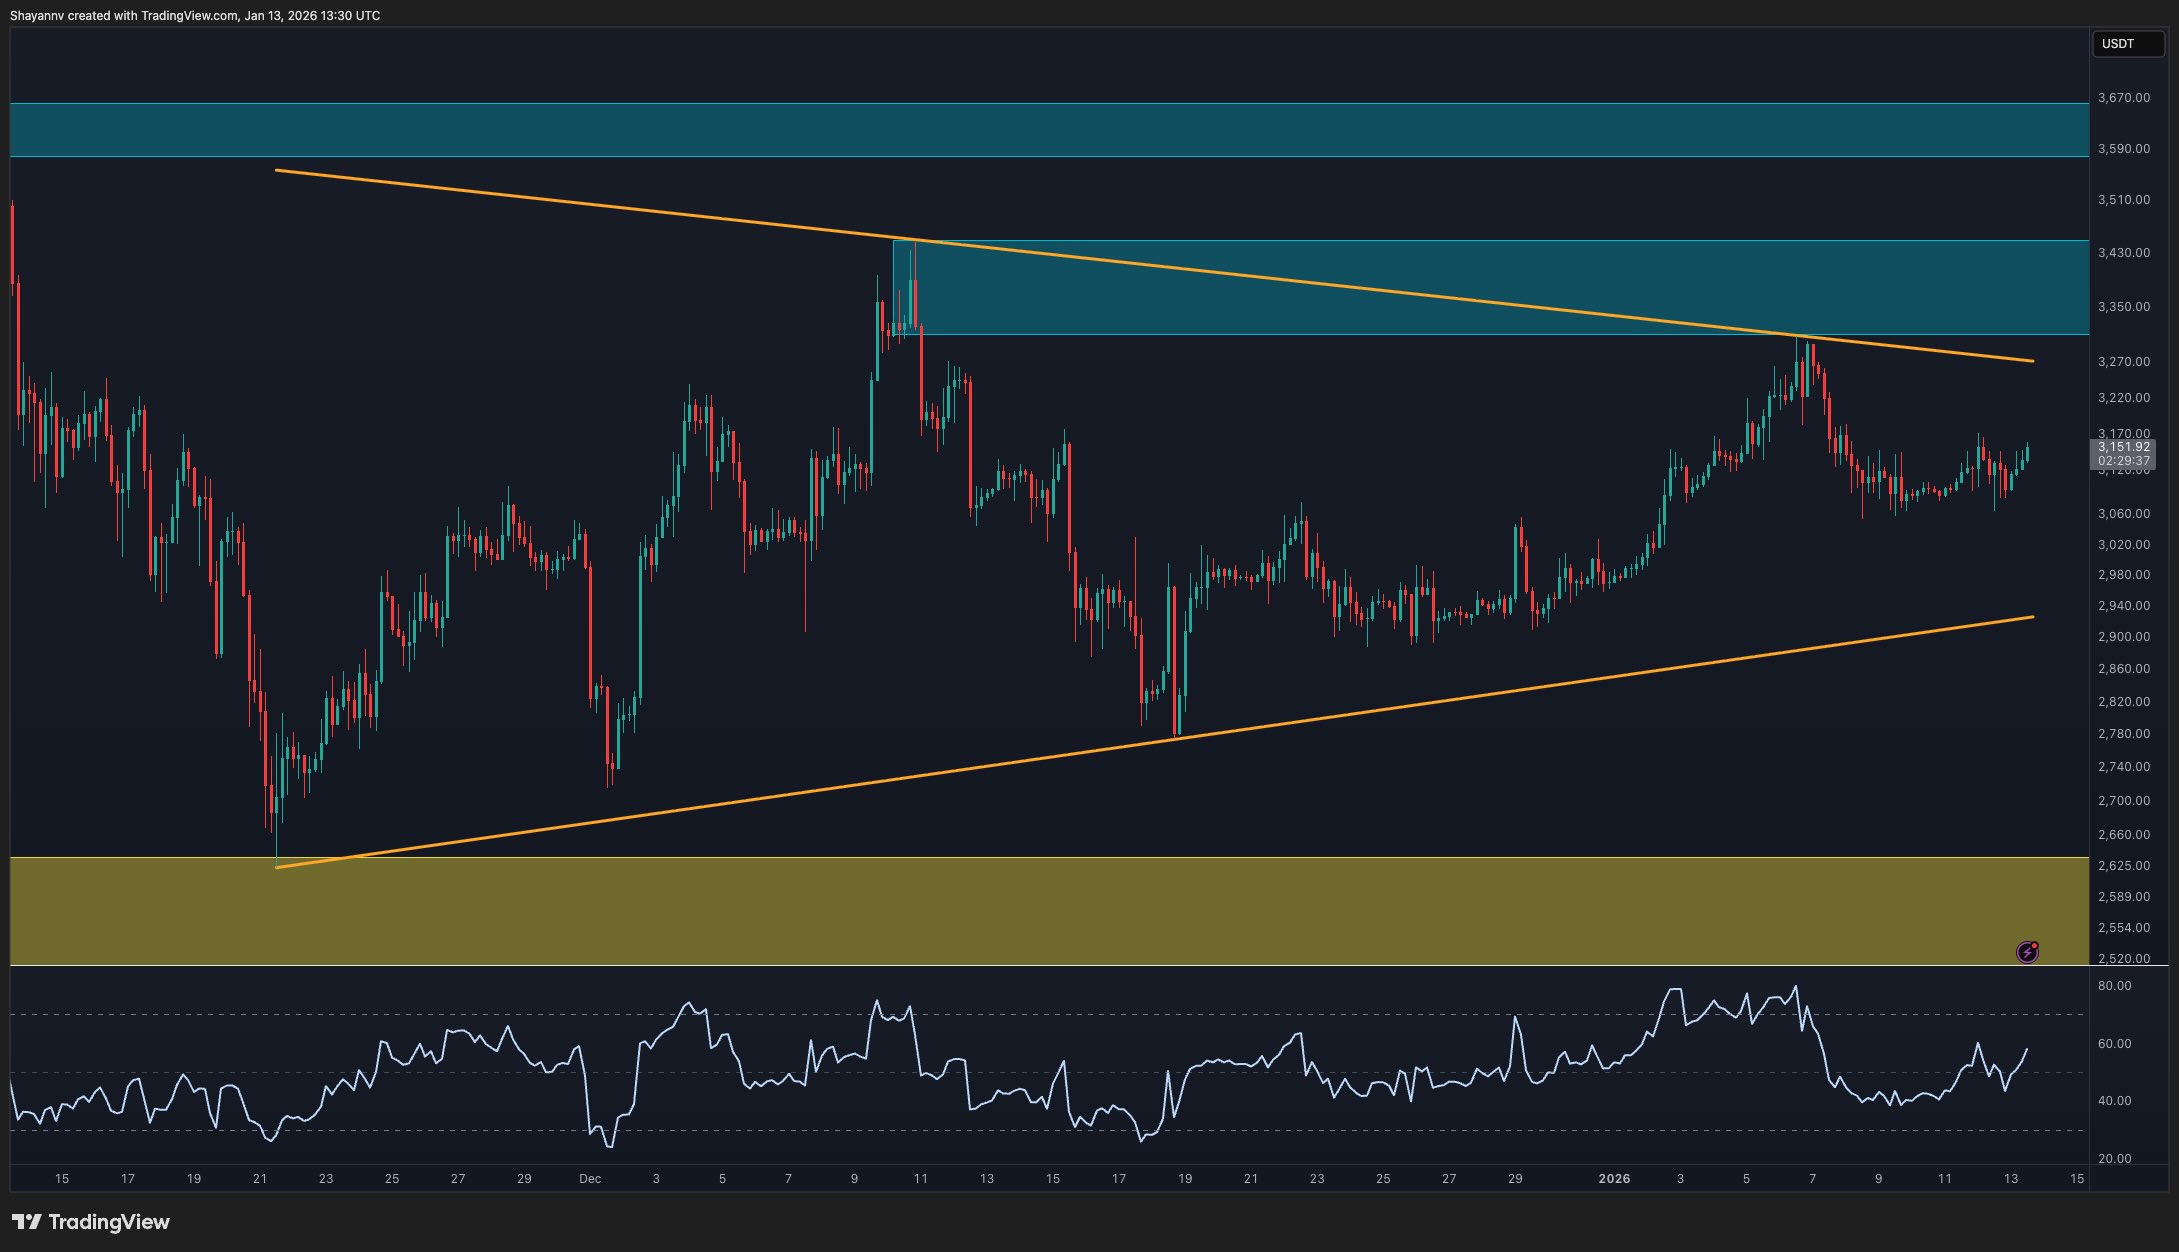
The 4H chart shows a clearer structure. ETH is trading inside a symmetrical triangle, with higher lows and lower highs forming since late November. The price recently tapped the triangle’s higher trendline and pulled back modestly, which is healthy rather than concerning.
Short-term resistance sits around the prior highs at $3.3k, which is also near the upper boundary of the channel. Support is also well-defined along the triangle’s lower boundary and the broader demand area below at $2.6k.
At the moment, the RSI is rising once again on the 4-hour timeframe, which points to bullish momentum being dominant on lower timeframes. If ETH holds this structure, the next attempt should target the upper boundary of the triangle again. On the other hand, a breakdown below triangle support would invalidate the short-term bullish structure and shift focus back to the $2.6k demand zone.
Onchain Analysis
Ethereum exchange reserves continue to trend lower, which is a constructive long-term signal. Despite the price weakness, coins are still leaving exchanges, suggesting reduced sell pressure and ongoing accumulation behavior rather than distribution.
Historically, sustained drops in exchange reserves during consolidation phases often precede stronger directional moves, once macro or market sentiment aligns. This doesn’t mean immediate upside, but it does reduce the probability of a sharp capitulation move from here. Therefore, on-chain data support the idea that ETH is being absorbed rather than dumped at current levels.

SECRET PARTNERSHIP BONUS for CryptoPotato readers: Use this link to register and unlock $1,500 in exclusive BingX Exchange rewards (limited time offer).
Disclaimer: Information found on CryptoPotato is those of writers quoted. It does not represent the opinions of CryptoPotato on whether to buy, sell, or hold any investments. You are advised to conduct your own research before making any investment decisions. Use provided information at your own risk. See Disclaimer for more information.